Last week, I shared how NASDAQ was sitting at support and primed for a rally. Nasdaq (ticker: NDX) finished the week 2% higher almost recovering all of the losses in March.
NASDAQ price analysis
Beginning February 16, 2021, NDX has been contained within this downward sloping price channel. Earlier this week, NDX popped above the resistance trend line of the price channel.
After breaking above, NDX prices retreated back to test the topside of the old resistance trend line. This behavior is quite common on breakouts and suggests Nasdaq may continue to rally further.
This type of price behavior opens the door for new all-time highs above $14,000.
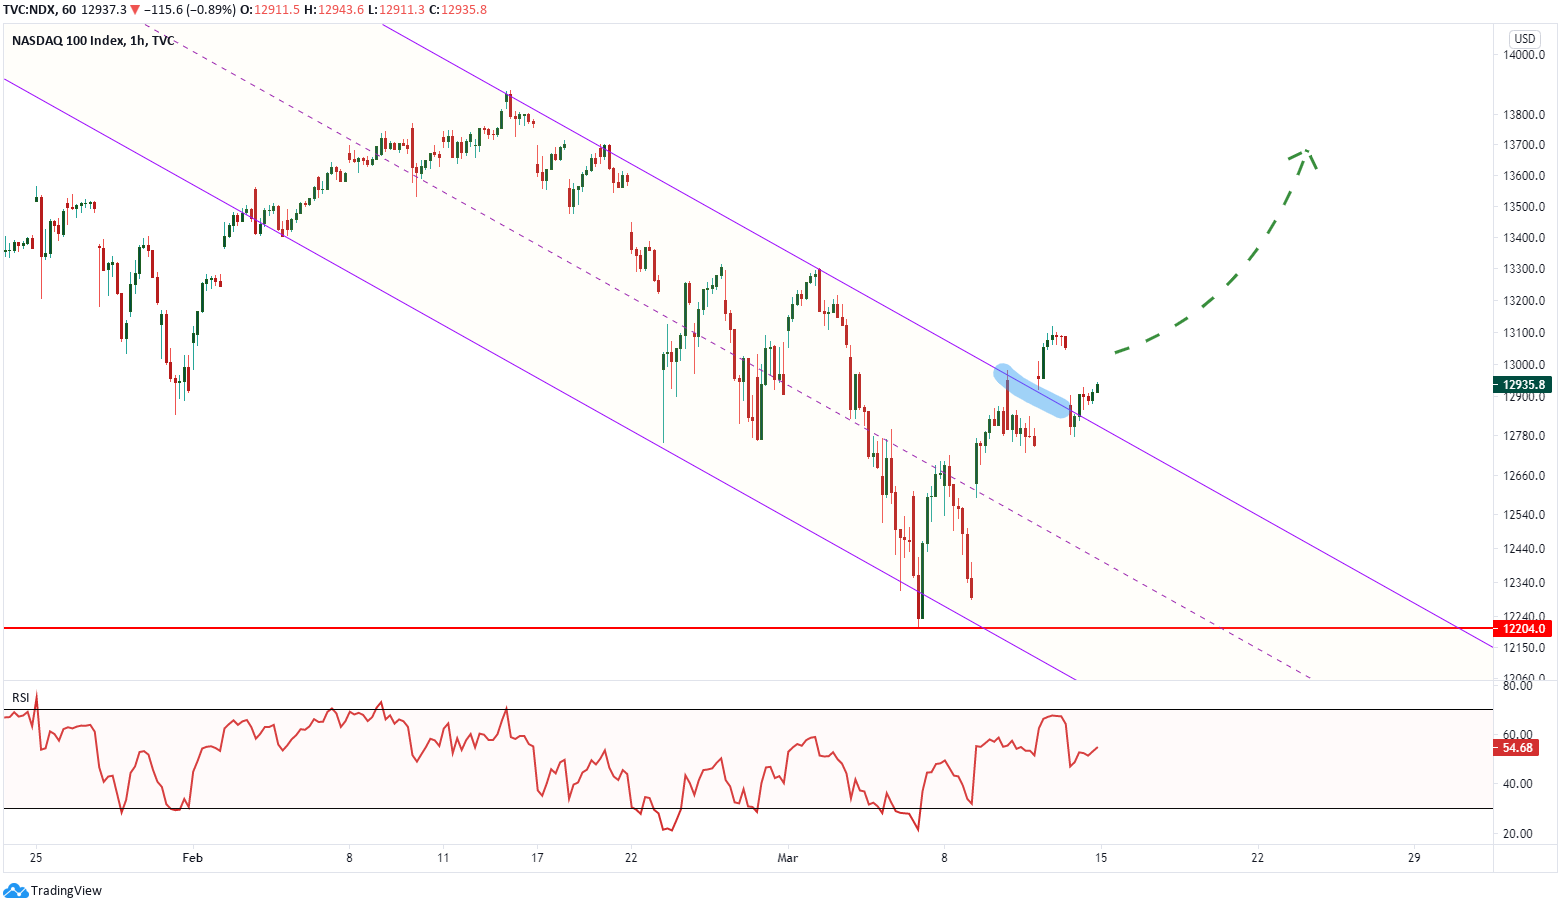
(click image to enlarge)
This bullish outlook remains in force so long as prices hold above the March 8 low of $12,288.
As this advance ebbs and flows, we will be able to draw another bullish trend channel to help frame the pricing for us.
We wrote this report as to why traders ten to miss their profitable expectations. Grab a free copy of the report when you join the Trading Price Newsletter sponsored by TradingPedia.