On Thursday gold for delivery in June traded within the range of $1,225.40-$1,245.80. Futures closed at $1,231.00, plummeting 0.96% on a daily basis. It has been the 26th drop in the past 52 trading days and also a third consecutive one. The daily low has been the lowest price level since April 7th, when a low of $1,224.60 was recorded. The precious metal has neutralized earlier gains, while currently being down 0.22% for the month, following three consecutive months of advance.
On the Comex division of the New York Mercantile Exchange, gold futures for delivery in June were edging up 0.06% on Friday to trade at $1,231.70 per troy ounce. The precious metal went up as high as $1,233.50 during the late phase of the Asian trading session, while the current daily low was at $1,227.00 per troy ounce, recorded during early Asian trade.
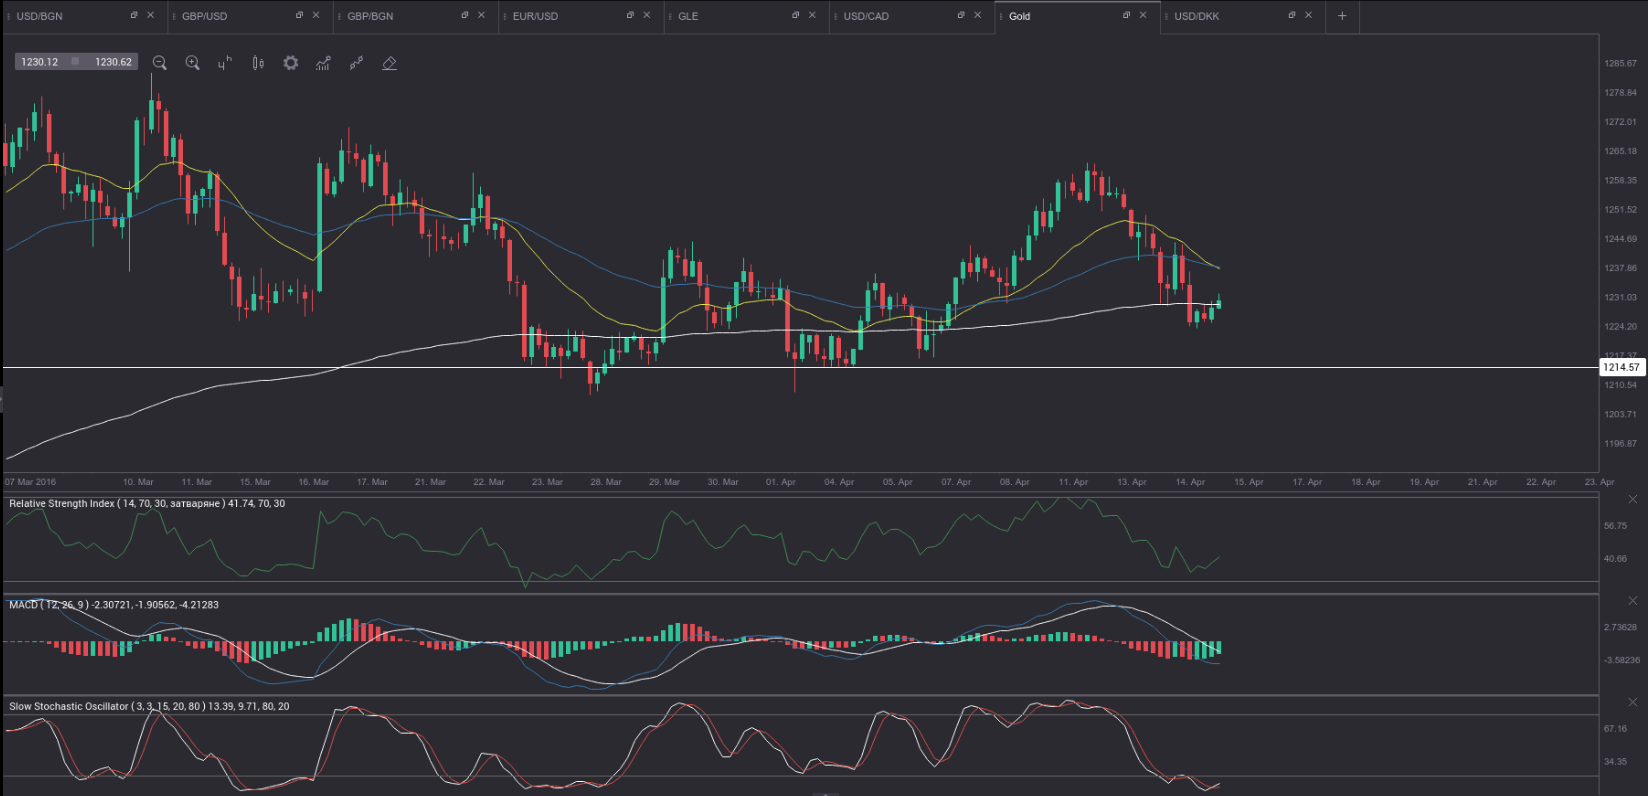
In technical terms, the 4-hour MACD suggests that bearish momentum has begun to fade, while the default Slow Stochastic Oscillator is about to move back above its oversold level (20.00). The 14-period RSI has recovered from recent lows and is about to reach 50.00. All these conditions suggest that the recent downswing in gold may have probably come to an end, while buyers probably expect to see consistent close above the 200-period Exponential Moving Average (white on the chart below).
Today the precious metal may be strongly influenced by the preliminary results from the Reuters/Michigan survey on US consumer sentiment. The survey may show that consumer confidence in the country improved in April. The preliminary reading of the corresponding index, which usually comes out two weeks ahead of the final data, probably rose to 92.5 during the current month from a final reading of 91.0 in March. The latter came well above the preliminary reading of 90.0, which was reported on March 18th. If expectations were met, April’s reading would be the highest since December 2015, when a level of 92.6 was reported. In case the preliminary gauge increased at a steeper pace than projected in April, this would have a moderate-to-strong bullish effect on the US dollar and a strong bearish effect on gold. The preliminary report is due out at 14:00 GMT.
A separate report may show that US industrial production rose at a monthly rate of 0.1% in March, according to market expectations, following a 0.5% contraction in the prior month. In case the general index of industrial activity outpaced expectations, this would be a bullish impulse for the dollar and a bearish impulse for gold. The Board of Governors of the Federal Reserve is to release the production data at 14:15 GMT.
Meanwhile, silver futures for delivery in May were gaining 0.40% on the day to trade at $16.265 per troy ounce, after going up as high as $16.285 a troy ounce during the early phase of the European trading session. It has been an exact test of the high from April 14th.
Daily and Weekly Pivot Levels
By employing the traditional calculation method, the daily pivot levels for gold are presented as follows:
Central Pivot Point – $1,234.07
R1 – $1,242.73
R2 – $1,254.47
R3 – $1,263.13
S1 – $1,222.33
S2 – $1,213.67
S3 – $1,201.93
By using the traditional method of calculation again, the weekly pivot levels for gold are presented as follows:
Central Pivot Point – $1,233.47
R1 – $1,251.93
R2 – $1,261.37
R3 – $1,279.83
S1 – $1,224.03
S2 – $1,205.57
S3 – $1,196.13