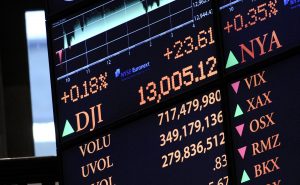
 On Wednesday Dow Jones Industrial Average traded within the range of 17,652.36-17,790.11. The benchmark closed at 17,716.66, rising 0.47% (83.15 points) on a daily basis. It has been the 25th gain in the past 41 trading days and also a fourth consecutive one. The daily high has been the highest level since December 17th 2015, when the Dow went up as high as 17,796.76. The blue-chip gauge has increased its advance to 7.27% so far during the current month.
Equities surged sharply on March 29th after at the Economic Club of New York Federal Reserve Chair, Janet Yellen, used a rather dovish tone regarding the future path of borrowing costs. Any announcements of a rate hike delay tend to urge investors to cut their holdings of fixed-income assets and pour their capital in the stock and commodity markets.
Among the companies included in the benchmark, 10 posted a daily decline on Wednesday and 20 posted a daily gain. Shares of Boeing Company (BA) recorded the worst performance within the Dow on March 30th, going down 1.76% to close at $128.58. It has been the 9th drop in the past 20 trading days, a sixth consecutive one and also the steepest one since February 19th. March 30th low of $128.02 per share has been the lowest price level since March 17th, when a low of $127.42 a share was registered. Boeing shares have trimmed their advance to 8.80% so far in March, following four consecutive months of decline. The aircraft manufacturer announced its intention to cut almost 4 000 job positions in its commercial aircraft division by mid-2016.
International Business Machines (IBM) was the second worst performer within the DJIA yesterday, depreciating 0.62% to close at $148.41 per share. It has been the 6th drop in the past 20 trading days. IBM has cut its advance to 13.26% so far in March, following a 5.00% surge in the preceding month.
At the same time, the shares of Visa Inc (V) registered the most notable daily increase within the DJIA on March 30th, going up 1.86%, to close at $76.78, while marking their 10th gain in the past 20 trading days, a second consecutive one and also the steepest one since March 11th. March 30th high of $77.00 per share has been the highest price level since December 31st 2015, when a high of $78.80 a share was registered. Visa has added 6.06% to its value so far in March, following three consecutive months of decline.
Apple Inc (AAPL) was the second best performer within the Dow on Wednesday, appreciating 1.75%, to close at $109.56. It has been the 13th gain in the past 20 trading days and also a second consecutive one. March 30th high of $110.42 per share has been the highest price level since December 17th 2015, when a high of $112.25 was recorded. In addition, the daily trading volume (45.60M) has been the highest since March 4th. Apple has added 13.31% to its value so far during the current month, following four consecutive months of decline. In February the stock went down 0.67%.
Daily and Weekly Pivot Levels
By employing the Camarilla calculation method, the Thursday pivot levels for DJIA are presented as follows:
R1 – 17,729.29
R2 – 17,741.91
R3 (range resistance) – 17,754.54
R4 (range breakout) – 17,792.42
S1 – 17,704.03
S2 – 17,691.41
S3 (range support) – 17,678.78
S4 (range breakout) – 17,640.90
By using the traditional method of calculation, the weekly pivot levels for DJIA are presented as follows:
Central Pivot Point – 17,521.23
R1 – 17,643.44
R2 – 17,771.16
R3 – 17,893.37
S1 – 17,393.51
S2 – 17,271.30
S3 – 17,143.58


