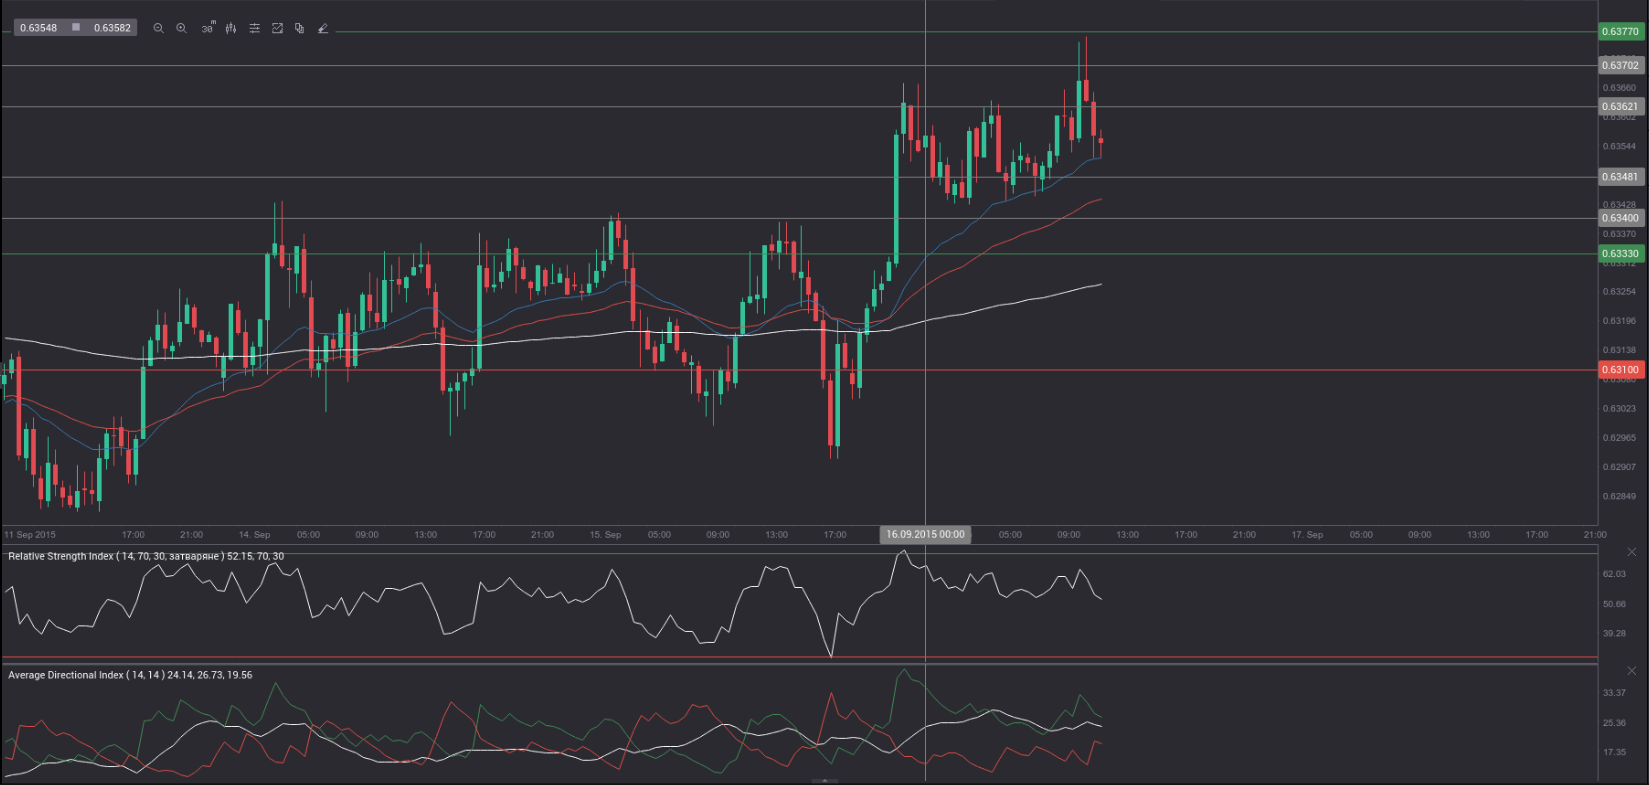
Yesterday’s trade saw NZD/USD within the range of 0.6291-0.6372. The pair closed at 0.6355, soaring 0.38% on a daily basis and marking a third consecutive trading day of gains. The daily high has been the highest level since September 10th, when the cross registered a high of 0.6400.
At 8:58 GMT today NZD/USD was up 0.02% for the day to trade at 0.6357. The pair tested the range resistance level (R3), as it touched a daily high at 0.6378 at 8:15 GMT.
Today the cross may be influenced by a number of macroeconomic reports as listed below.
Fundamentals
New Zealand
Gross Domestic Product
New Zealands Gross Domestic Product (GDP) probably expanded 2.5% during the second quarter of the year compared to the same period a year ago, according to market expectations, after in Q1 the economy grew at an annualized rate of 2.6%. If so, this would be the slowest annual rate of increase since the second quarter of 2013, when the GDP grew 2.3%.
In quarterly terms, economy probably grew at a pace of 0.5% in Q2. In the first three months of 2015 the nations GDP expanded 0.2%, or at the slowest quarterly rate since Q3 2012. In Q1 the key industries such as agriculture, forestry and mining shrank 2.9%, which followed a 0.3% slump in Q4 2014. Mining sector activity was 7.8% lower in Q1, as extraction and exploration of oil and gas shrank considerably, because of lower international prices in the sector. Activity in the nations agriculture fell 2.3%, as production of milk contracted. On the other hand, a positive GDP contribution was provided by retail trade and accommodation, with the latter expanding 2.4% in Q1 compared to Q4 2014.
In terms of expenditure measure of the GDP, household spending in New Zealand expanded 0.7% in the first quarter of the year, while investment activity shrank 1.9%, according to the report by Statistics New Zealand.
In case the economy expanded at a faster-than-projected pace in Q2, this would be considered as a strong bullish signal for the local dollar. The official report is due out at 22:45 GMT.
United States
Consumer inflation
The annualized consumer inflation in the United States probably remained steady at 0.2% in August, according to market expectations. It has been the highest annual rate since December 2014, when inflation was reported at 0.8%. In June consumer prices rose 0.1% year-on-year, supported by higher costs of shelter. In monthly terms, the Consumer Price Index (CPI) probably showed a flat performance in August, following six consecutive monthly increases. In July the CPI went up at a monthly rate of 0.1%.
In July the largest upward pressure came from prices of services less energy (up 2.6% year-on-year, following a 2.5% increase in the prior month). Within this category, shelter cost rose 3.1% in July, following a 3.0% increase in June, while cost of medical care was up at an annual 2.3%, or the same rate as a month ago. In addition, cost of transportation services went up 2.1% in July, following a 1.7% surge in June. Prices of food rose 1.6% in July, following a 1.8% surge in June, while cost of energy slumped 14.8% year-on-year in July, after a 15% drop in the prior month, according to the report by the Bureau of Labor Statistics.
The CPI is based on a basket of goods and services bought and used by consumers on a daily basis. In the United States the Bureau of Labor Statistics (BLS) surveys the prices of 80 000 consumer items in order to calculate the index. The latter reflects prices of commonly purchased items by primarily urban households, which represent about 87% of the US population. The Bureau processes price data from 23 000 retail and service businesses.
The CPI includes sales taxes, but excludes income taxes, costs of investments such as stocks and bonds and sales prices of homes.
The annualized core consumer inflation, which is stripped of prices of food and energy, probably continued to accelerate in August, reaching a level of 1.9%, according to the median forecast by experts, up from 1.8% in July. If so, this would be the highest annual core inflation since July 2014, when a rate of 1.9% was registered. It is usually reported as a seasonally adjusted figure, because consumer patterns are widely fluctuating in dependence on the time of the year. The Core CPI is a key measure, because this is the gauge, which the Federal Reserve Bank takes into account in order to adjust its monetary policy. The Fed uses the core CPI, because prices of food, oil and gas are highly volatile, while the central bank’s tools are slow-acting. In case, for example, prices of oil plunge considerably, this could result in a low rate of inflation, but the central bank will not take action until this decrease affects prices of other goods and services.
If the CPI tends to approach the inflation objective, set by the Federal Reserve and considered as providing price stability, or a level below but close to 2%, this will usually bolster the appeal of the US dollar.
The Bureau of Labor Statistics is to release the official CPI report at 12:30 GMT. The data will add to the array of key indicators, which the Federal Reserve will take into account before announcing its policy decision tomorrow.
NAHB Housing Market Index
The National Association of Home Builders (NAHB) Housing Market Index probably remained stable in September at a reading of 61.0, according to market expectations. If so, this would be the 14th consecutive month, when the gauge stood in the area above 50.0, and also the highest level since November 2005. The indicator is based on a monthly survey in regard to current home sales and expected sales in the coming six months. Values above the key level of 50.0 indicate that housing market conditions are good. Therefore, higher-than-projected readings would provide support to the US dollar. The official data is scheduled for release at 14:00 GMT.
Bond Yield Spread
The yield on New Zealands 2-year government bonds went as high as 2.465% on September 15th, after which it slid to 2.450% at the close to lose 0.005 percentage point on a daily basis, while marking a second straight trading day of increase.
The yield on US 2-year government bonds climbed as high as 0.815% on September 15th, or the highest level in more than three months, after which it fell to 0.802% at the close to add 7.2 basis points (0.072 percentage point) for the day, while marking a second consecutive trading day of increase.
The spread between 2-year New Zealand and 2-year US bond yields, which reflects the flow of funds in a short term, shrank to 1.648% on September 15th from 1.725% during the prior day. The September 15th yield difference has been the lowest one in more than three months.
Meanwhile, the yield on New Zealands 10-year government bonds soared as high as 3.295% on September 15th, after which it slid to 3.280% at the close to appreciate 0.005 percentage point compared to September 14th.
The yield on US 10-year government bonds climbed as high as 2.294% on September 15th, or the highest level since July 30th (2.322%), after which it slipped to 2.276% at the close to add 9.3 basis points (0.093 percentage point) on a daily basis.
The spread between 10-year New Zealand and 10-year US bond yields narrowed to 1.004% on September 15th from 1.088% during the prior day. The September 15th yield difference has been the lowest one since August 26th, when the spread was 1.000%.
Daily and Weekly Pivot Levels
By employing the Camarilla calculation method, the daily pivot levels for NZD/USD are presented as follows:
R1 – 0.6362
R2 – 0.6370
R3 (range resistance) – 0.6377
R4 (range breakout) – 0.6400
S1 – 0.6348
S2 – 0.6340
S3 (range support) – 0.6333
S4 (range breakout) – 0.6310
By using the traditional method of calculation, the weekly pivot levels for NZD/USD are presented as follows:
Central Pivot Point – 0.6330
R1 – 0.6418
R2 – 0.6520
R3 – 0.6608
S1 – 0.6228
S2 – 0.6140
S3 – 0.6038