Yesterday’s trade saw EUR/USD within the range of 1.1257-1.1328. The pair closed at 1.1266, falling 0.49% on a daily basis and extending losses from Monday. The daily low has been the lowest level since September 11th, when the cross registered a low of 1.1253.
At 6:56 GMT today EUR/USD was up 0.05% for the day to trade at 1.1275. The pair made an attempt to test the upper range breakout level (R4), as it touched a daily high at 1.1299 at 3:25 GMT.
Today the cross may be influenced by a number of macroeconomic reports as listed below.
Fundamentals
Euro area
Consumer inflation – final estimate
The final annualized consumer inflation in the Euro zone, evaluated in accordance with Eurostat’s harmonized methodology, probably confirmed the preliminary rate at 0.2% in August, which was reported on August 31st. If so, this would be the fourth straight month, when annual consumer inflation inhabited positive territory. In June and July the final HICP reading also pointed to annual inflation rate of 0.2%, which matched the preliminary estimate. According to the preliminary data, in August the rate is expected to be influenced the most by cost of food, alcohol & tobacco (up 1.2% year-on-year, following a 0.9% surge in July) and cost of services (up 1.2%, stable in comparison with July). Prices of non-energy industrial goods rose at an annual rate of 0.6% in August, after a 0.4% increase in July, while, on the other hand, energy prices are projected to show the largest annual drop, or 7.1%, following a 5.6% decline in July.
The index shows the change in price levels of a basket of goods and services from consumer’s perspective and also reflects purchasing trends. The main components of the HICP are food, alcohol and tobacco (accounting for 19% of the total weight), energy (11%), non-energy industrial goods (29%) and services (41%).
The HICP is used to evaluate and compare inflation rates between Member States, according to Art. 121 of the Amsterdam’s Agreement and directives by the European Central Bank (ECB), in order the latter is enabled to maintain price stability and to implement monetary policy.
In case the HICP accelerated more than anticipated, thus, further approaching the 2% inflation objective set by the ECB, this would support demand for the euro, because it implies that monetary policy measures have begun to work in favor of economic activity.
The final annualized Core HICP for August probably matched the preliminary estimate of a 1.0% surge, which was reported on August 31st. In July the final Core HICP increased at an annual rate of 1.0% as well, matching the preliminary estimate. It has been a level unseen since April 2014. This index excludes volatile categories such as food, energy, alcohol and tobacco. Eurostat is scheduled to release the final inflation data at 9:00 GMT.
United States
Consumer inflation
The annualized consumer inflation in the United States probably remained steady at 0.2% in August, according to market expectations. It has been the highest annual rate since December 2014, when inflation was reported at 0.8%. In June consumer prices rose 0.1% year-on-year, supported by higher costs of shelter. In monthly terms, the Consumer Price Index (CPI) probably showed a flat performance in August, following six consecutive monthly increases. In July the CPI went up at a monthly rate of 0.1%.
In July the largest upward pressure came from prices of services less energy (up 2.6% year-on-year, following a 2.5% increase in the prior month). Within this category, shelter cost rose 3.1% in July, following a 3.0% increase in June, while cost of medical care was up at an annual 2.3%, or the same rate as a month ago. In addition, cost of transportation services went up 2.1% in July, following a 1.7% surge in June. Prices of food rose 1.6% in July, following a 1.8% surge in June, while cost of energy slumped 14.8% year-on-year in July, after a 15% drop in the prior month, according to the report by the Bureau of Labor Statistics.
The CPI is based on a basket of goods and services bought and used by consumers on a daily basis. In the United States the Bureau of Labor Statistics (BLS) surveys the prices of 80 000 consumer items in order to calculate the index. The latter reflects prices of commonly purchased items by primarily urban households, which represent about 87% of the US population. The Bureau processes price data from 23 000 retail and service businesses.
The CPI includes sales taxes, but excludes income taxes, costs of investments such as stocks and bonds and sales prices of homes.
The annualized core consumer inflation, which is stripped of prices of food and energy, probably continued to accelerate in August, reaching a level of 1.9%, according to the median forecast by experts, up from 1.8% in July. If so, this would be the highest annual core inflation since July 2014, when a rate of 1.9% was registered. It is usually reported as a seasonally adjusted figure, because consumer patterns are widely fluctuating in dependence on the time of the year. The Core CPI is a key measure, because this is the gauge, which the Federal Reserve Bank takes into account in order to adjust its monetary policy. The Fed uses the core CPI, because prices of food, oil and gas are highly volatile, while the central bank’s tools are slow-acting. In case, for example, prices of oil plunge considerably, this could result in a low rate of inflation, but the central bank will not take action until this decrease affects prices of other goods and services.
If the CPI tends to approach the inflation objective, set by the Federal Reserve and considered as providing price stability, or a level below but close to 2%, this will usually bolster the appeal of the US dollar.
The Bureau of Labor Statistics is to release the official CPI report at 12:30 GMT. The data will add to the array of key indicators, which the Federal Reserve will take into account before announcing its policy decision tomorrow.
NAHB Housing Market Index
The National Association of Home Builders (NAHB) Housing Market Index probably remained stable in September at a reading of 61.0, according to market expectations. If so, this would be the 14th consecutive month, when the gauge stood in the area above 50.0, and also the highest level since November 2005. The indicator is based on a monthly survey in regard to current home sales and expected sales in the coming six months. Values above the key level of 50.0 indicate that housing market conditions are good. Therefore, higher-than-projected readings would provide support to the US dollar. The official data is scheduled for release at 14:00 GMT.
Bond Yield Spread
The yield on German 2-year government bonds went as high as -0.219% on September 15th, after which it slid to -0.220% at the close to add 0.008 percentage point on a daily basis. It has been the first gain in the past three trading days.
The yield on US 2-year government bonds climbed as high as 0.815% on September 15th, or the highest level in more than three months, after which it fell to 0.802% at the close to add 7.2 basis points (0.072 percentage point) for the day, while marking a second consecutive trading day of increase.
The spread between 2-year US and 2-year German bond yields, which reflects the flow of funds in a short term, expanded to 1.022% on September 15th from 0.958% during the prior day. The September 15th yield difference has been the most notable one in more than three months.
Meanwhile, the yield on German 10-year government bonds soared as high as 0.750% on September 15th, or the highest level since September 3rd (0.801%), after which it slid to 0.745% at the close to appreciate 8.5 basis points (0.085 percentage point) compared to September 14th, while marking a second straight trading day of gains.
The yield on US 10-year government bonds climbed as high as 2.294% on September 15th, or the highest level since July 30th (2.322%), after which it slipped to 2.276% at the close to add 9.3 basis points (0.093 percentage point) on a daily basis.
The spread between 10-year US and 10-year German bond yields expanded to 1.531% on September 15th from 1.527% during the prior day. The September 15th yield difference has been the largest one since September 10th, when the spread was 1.534%.
Daily and Weekly Pivot Levels
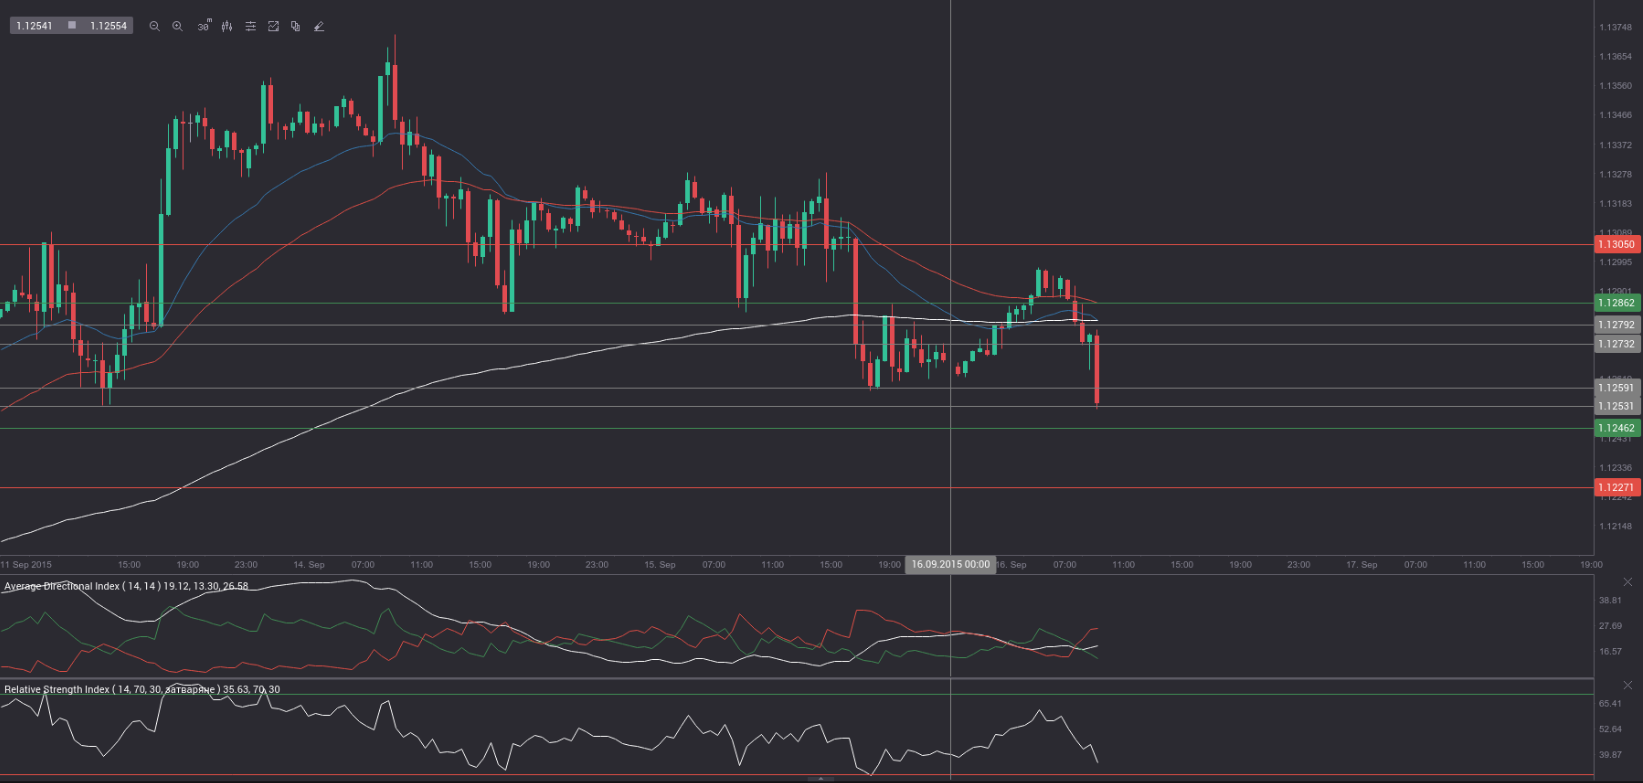
By employing the Camarilla calculation method, the daily pivot levels for EUR/USD are presented as follows:
R1 – 1.1273
R2 – 1.1279
R3 (range resistance – green on the 30-minute chart) – 1.1286
R4 (range breakout – red on the 30-minute chart) – 1.1305
S1 – 1.1259
S2 – 1.1253
S3 (range support – green on the 30-minute chart) – 1.1246
S4 (range breakout – red on the 30-minute chart) – 1.1227
By using the traditional method of calculation, the weekly pivot levels for EUR/USD are presented as follows:
Central Pivot Point – 1.1270
R1 – 1.1419
R2 – 1.1499
R3 – 1.1648
S1 – 1.1190
S2 – 1.1041
S3 – 1.0961