Yesterday’s trade saw USD/JPY within the range of 116.46-122.04. The pair closed at 118.42, plummeting 2.72% on a daily basis, or the most considerable daily loss since June 11th 2013, when it depreciated 2.77%. The daily low has also been the lowest level since January 16th, when the cross registered a low of 115.82.
At 7:52 GMT today USD/JPY was up 1.18% for the day to trade at 119.81. The pair touched a daily high at 120.11 at 2:35 GMT.
Today the cross may be influenced by a number of macroeconomic reports as listed below.
Fundamentals
United States
Services PMI by Markit – preliminary estimate
Activity in the US sector of services probably expanded in August, with the corresponding preliminary Purchasing Managers Index coming in at a reading of 56.0. If so, this would be the highest index reading since May, when the PMI stood at 56.2. In July the final seasonally adjusted PMI came in at 55.7, up from a preliminary value of 55.2. The PMI is based on data collected from a representative panel of more than 400 private sector companies, which encompasses industries such as transport and communication, financial intermediaries, business and personal services, computing & IT and hotels and restaurants. Values above the key level of 50.0 indicate optimism (expanding activity). In case a larger-than-projected improvement in services sector activity was reported, this would have a moderate bullish effect on the US dollar. The preliminary data by Markit Economics is due out at 13:45 GMT.
New Home Sales
Sales of new single-family homes probably rose 6.0% to the seasonally adjusted annual rate of 520 000 in July, according to market expectations. The index of new home sales fell 6.8% to the annual rate of 482 000 units in June, which has been the lowest level since November 2014, when a figure of 431 000 was reported. Sales in the West registered the largest monthly drop (-17%), followed by the Midwest (-11.1%) and the South (-4.1%). At the same time, sales in the Northeast went up at a monthly rate of 28%.
The median sales price of new houses sold was USD 281 800 in June, while the average sales price was USD 328 700. The seasonally adjusted estimate of new houses for sale was 215 000 at the end of June, which represents a supply of 5.4 months at the current sales rate, according to the report by the US Census Bureau.
There are several points to watch out for when interpreting the New Home Sales numbers. First of all, the statistics does not record any houses, which are not going to be sold immediately. As an example, the case when a house is commissioned to be built on an existing plot of land, that the purchaser owns.
Second, the statistics are taken at the point where a customer has signed a sales contract or has put a deposit down. At this point the house can be at any stage of construction.
Third, the sales figures are not adjusted to take into account the sales contracts, which are eventually canceled by the builder or the customer. However, the same house is not included in any subsequent count when it is eventually sold to another customer.
In case the index showed a better-than-anticipated performance, this would bolster demand for the US dollar. The Census Bureau is to report the official figure at 14:00 GMT.
CB Consumer Confidence Index
Confidence among consumers in the United States probably improved in August, with the corresponding index coming in at a reading of 93.3, according to expectations, from 90.9 in July. The latter has been the lowest index value since September, when the gauge was reported at 89.0.
This indicator measures the level of individuals confidence in the US economic development. It is considered as a leading indicator, as it gives an early insight into consumer spending, which accounts for most of the nations GDP.
The index has 1985 as a base year, when the base value was 100. This year was chosen, as it was neither a peak nor a bottom. The Consumer Confidence Index (CCI) is calculated on the basis of a household survey, which reflects consumers opinion on current conditions and future expectations regarding the US economy. Opinions on current conditions account for 40% of the index, while expectations of future conditions account for the remaining 60%. The surveys objective is to define consumer attitudes and buying intentions, while the data are filtered by age, income and region.
A sample of 5 000 households in the United States serves as a basis for the survey. Each month respondents give their opinion based on the answers to five questions: Current business conditions; Business conditions for the next six months; Current employment conditions; Employment conditions for the next six months; Total family income for the next six months. Respondents may answer each question as “positive”, “negative” or “neutral”.
Each of the five questions is given a “relative value”, or the positive responses are divided by the sum of the positive and negative responses. The relative value is then compared against each relative value from the base year (1985). The comparison of the relative values leads to the “index value” for all five questions. These index values are then averaged in order to form the value of the CCI.
In case the index rose more than anticipated, this would support the US dollar, as higher confidence suggests a greater willingness to spend and, respectively, an accelerating economic growth. The Conference Board research group is to publish the official index reading at 14:00 GMT.
Bond Yield Spread
The yield on Japanese 2-year government bonds went as high as 0.010% on August 24th, or the highest level since August 11th (0.013%), after which it slid to 0.006% at the close to remain unchanged compared to August 21st.
The yield on US 2-year government bonds climbed as high as 0.613% on August 24th, after which it fell to 0.588% at the close to lose 3.3 basis points (0.033 percentage point) compared to August 21st. It has been the fourth straight trading day of decline. The yield fell as low as 0.544% yesterday, or the lowest level since July 8th (0.541%).
The spread between 2-year US and 2-year Japanese bond yields, which reflects the flow of funds in a short term, shrank to 0.582% on August 24th from 0.615% on August 21st. The August 24th yield difference has been the lowest one since July 8th, when the spread was 0.539%.
Meanwhile, the yield on Japans 10-year government bonds soared as high as 0.362% on August 24th, after which it slid to 0.358% at the close to remain unchanged compared to August 21st. The yield dropped to as low as 0.349% yesterday, or the lowest level since May 1st (0.342%).
The yield on US 10-year government bonds climbed as high as 2.045% on August 24th, after which it slipped to 2.014% at the close to lose 3.1 basis points (0.031 percentage point) compared to August 21st, while marking a fourth consecutive day of decrease. The yield fell as low as 1.905% yesterday, or the lowest level since April 27th (1.895%).
The spread between 10-year US and 10-year Japanese bond yields narrowed to 1.656% on August 24th from 1.687% on August 21st. The August 24th yield difference has been the lowest one in more than two months.
Daily and Weekly Pivot Levels
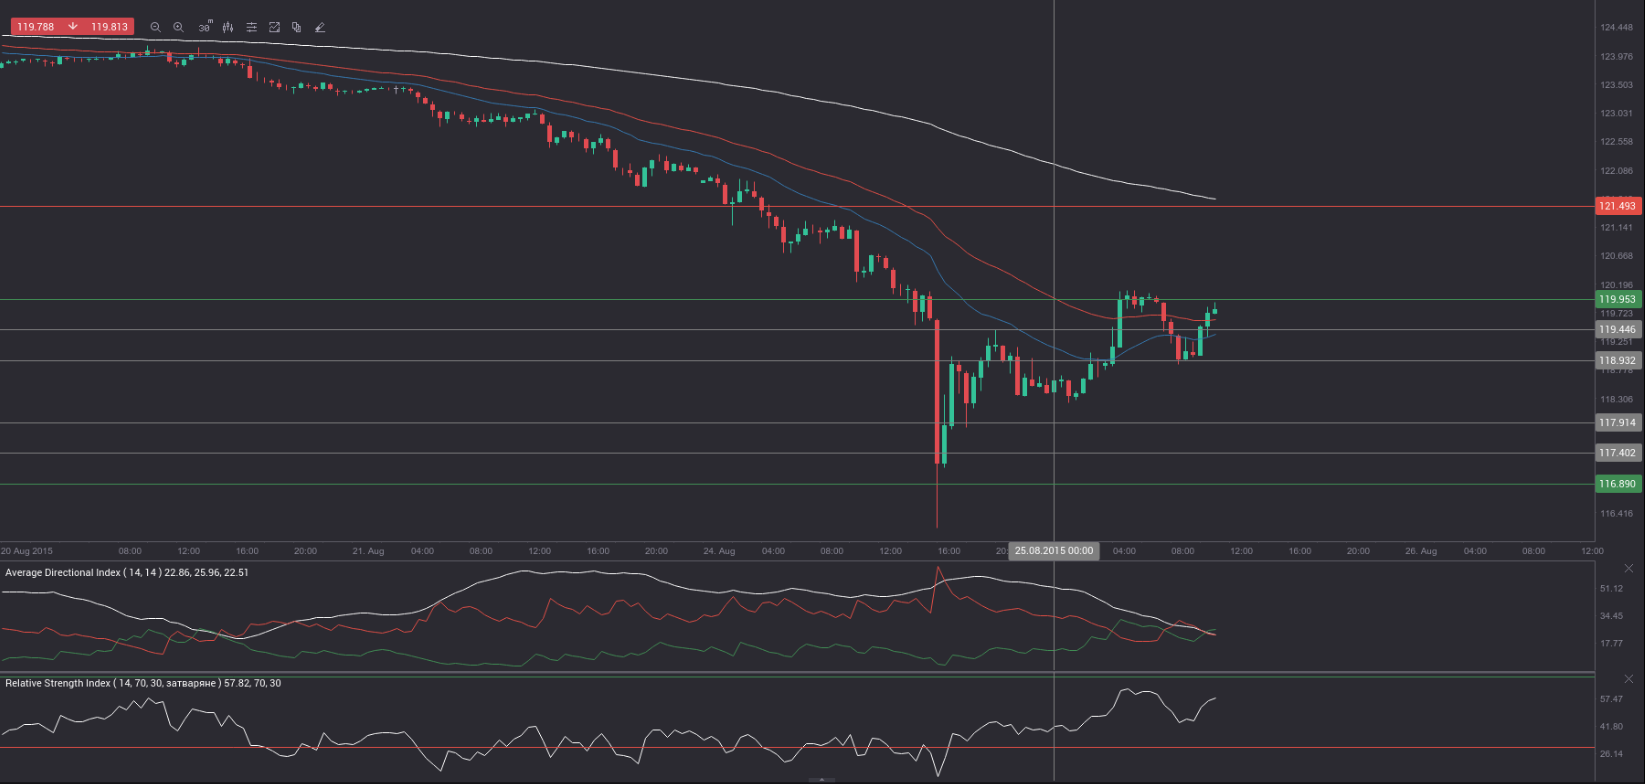
By employing the Camarilla calculation method, the daily pivot levels for USD/JPY are presented as follows:
R1 – 118.93
R2 – 119.44
R3 (range resistance – green on the 30-minute chart) – 119.95
R4 (range breakout – red on the 30-minute chart) – 121.49
S1 – 117.91
S2 – 117.40
S3 (range support – green on the 30-minute chart) – 116.89
S4 (range breakout – red on the 30-minute chart) – 115.35
By using the traditional method of calculation, the weekly pivot levels for USD/JPY are presented as follows:
Central Pivot Point – 122.80
R1 – 123.81
R2 – 125.58
R3 – 126.59
S1 – 121.03
S2 – 120.02
S3 – 118.25