Yesterday’s trade saw EUR/USD within the range of 1.1017-1.1137. The pair closed at 1.1119, soaring 0.89% on a daily basis. It has been the first daily gain in the past five trading days and also the most considerable rate of increase since August 12th, when the cross appreciated 1.06%. The daily high has been the highest level since August 14th, when the cross registered a high of 1.1188.
At 7:47 GMT today EUR/USD was down 0.03% for the day to trade at 1.1116. The pair touched a daily low at 1.1112 at 7:46 GMT.
Today the cross may be influenced by a number of macroeconomic reports as listed below.
Fundamentals
United States
FOMC Minutes release
The greenback continued losing ground against the euro on Wednesday, as the minutes from the Federal Reserves latest policy meeting indicated that conditions for the first rate hike in a decade had not yet been present, but are approaching. Meanwhile, the US labor market conditions continue improving, but annual inflation rate remains far below the central banks inflation objective.
According to excerpts from the FOMC Minutes released yesterday: “…several participants noted that a material slowdown in Chinese economic activity could pose risks to the U.S. economic outlook. Some participants also discussed the risk that a possible divergence in interest rates in the United States and abroad might lead to further appreciation of the dollar, extending the downward pressure on commodity prices and the weakness in net exports.”
“Most judged that the conditions for policy firming had not yet been achieved, but they noted that conditions were approaching that point. Participants observed that the labor market had improved notably since early this year, but many saw scope for some further improvement.”
“…the economic conditions warranting an increase in the target range for the federal funds rate had not yet been met. Members generally agreed that additional information on the outlook would be necessary before deciding to implement an increase in the target range. One member, however, indicated a readiness to take that step at this meeting but was willing to wait for additional data to confirm a judgment to raise the target range.”
Initial, Continuing Jobless Claims
The number of people in the United States, who filed for unemployment assistance for the first time during the business week ended on August 14th, probably decreased to 272 000, according to market expectations, from 274 000 in the prior week. The latter has been the highest number of claims since the business week ended on July 10th, when 281 000 claims were reported.
The 4-week moving average, an indicator lacking seasonal effects, was 266 250, marking a decrease of 1 750 compared to the preceding weeks revised down average. It has been the lowest level for this average since April 15th 2000.
The business week, which ended on August 7th has been the 23rd consecutive week, when jobless claims stood below the 300 000 threshold. This boosts the case labor market conditions in the country continued to improve. Claims are usually volatile during the summer period, as automakers shut assembly plants for annual retooling and also due to school vacations.
Initial jobless claims number is a short-term indicator, reflecting lay-offs in the country. In case the number of claims met expectations or dropped further, this would have a bullish effect on the US dollar.
The number of continuing jobless claims probably decreased to the seasonally adjusted 2 265 000 during the business week ended on August 7th from 2 273 000 in the prior week. The latter represented an increase by 15 000 compared to the revised up number of claims, reported in the business week ended on July 24th. This indicator reflects the actual number of people unemployed and currently receiving unemployment benefits, who filed for unemployment assistance at least two weeks ago.
The Department of Labor is to release the weekly report at 12:30 GMT.
Philadelphia FED manufacturing Index
The Philadelphia Fed Manufacturing Index probably improved to a reading of 7.0 in August from 5.7 index points during the previous month. The latter has been the lowest level since March 2015, when the gauge was reported at 5.0. The index is based on a monthly business survey (the Business Outlook Survey), measuring manufacturing activity in the third district of the Federal Reserve, Philadelphia. Participants give their opinion about the direction of business changes in overall economy and different indicators of activity in their companies, such as employment, working hours, new and existing orders, deliveries, inventories, delivery time, price etc. The survey is conducted every month since May 1968. The results are presented as the difference between the percentages of positive and negative projections. A level above zero is indicative of improving conditions, while a level below zero is indicative of worsening conditions. Higher-than-expected index readings would have a moderate bearish effect on the greenback. The Federal Reserve Bank of Philadelphia is expected to release the official results from the survey at 14:00 GMT.
Existing Home Sales
The index of existing home sales in the United States probably fell 0.6% to a level of 5.44 million in July compared to June, according to the median estimate by experts. If so, this would be the first drop in the past three months. In June compared to May existing home sales rose 3.2% to 5.49 million, or the highest level since May 2010 (5.66 million). The sample of data encompasses condos, co-ops and single-family houses.
Statistical data on existing home sales is often used along with statistical figures regarding the new home sales and pending home sales, with the major objective being to draw a conclusion how the nation’s housing sector is performing, regardless of interest rates. The most active house-purchasing period in the United States is usually between the months of March through June. Therefore, in case statistical data revealed a sudden drop in the number of homes sold rather than an improvement during this period, this would be considered as a signal of weakness in the country’s housing market.
The report on existing home sales usually does not cause a real direct impact on US economy. Actually, this effect appears to be minimal, due to the fact that nothing is produced with the mere sale of an existing home. In terms of economic activity, the sale of an existing house may be related only to interior design and purchases of new furniture.
In case the index dropped at a steeper monthly rate than anticipated, this would have a limited bearish effect on the US dollar. The National Association of Realtors (NAR) is to release the official figure at 14:00 GMT.
Bond Yield Spread
The yield on German 2-year government bonds went as high as -0.241% on August 19th, or matching the high from the previous trading day, after which it slid to -0.252% at the close to remain unchanged on a daily basis.
The yield on US 2-year government bonds climbed as high as 0.738% on August 19th, or the highest level since August 14th (0.738%), after which it fell to 0.665% at the close to lose 5.7 basis points (0.057 percentage point) for the day.
The spread between 2-year US and 2-year German bond yields, which reflects the flow of funds in a short term, shrank to 0.917% on August 19th from 0.974% during the prior day. The August 19th spread has been the lowest one since August 3rd, when the difference was 0.900%.
Meanwhile, the yield on German 10-year government bonds soared as high as 0.665% on August 19th, or the highest level since August 11th (0.679%), after which it slid to 0.618% at the close to depreciate 2.2 basis points (0.022 percentage point) compared to August 18th. It has been the second drop in the past three trading days.
The yield on US 10-year government bonds climbed as high as 2.230% on August 19th, or the highest level since August 11th (2.232%), after which it slipped to 2.131% at the close to lose 6.1 basis points (0.061 percentage point) on a daily basis. It has been the second drop in the past three trading days.
The spread between 10-year US and 10-year German bond yields narrowed to 1.513% on August 19th from 1.552% during the prior day. The August 19th yield difference has been the lowest one since August 7th, when the spread was 1.508%.
Daily and Weekly Pivot Levels
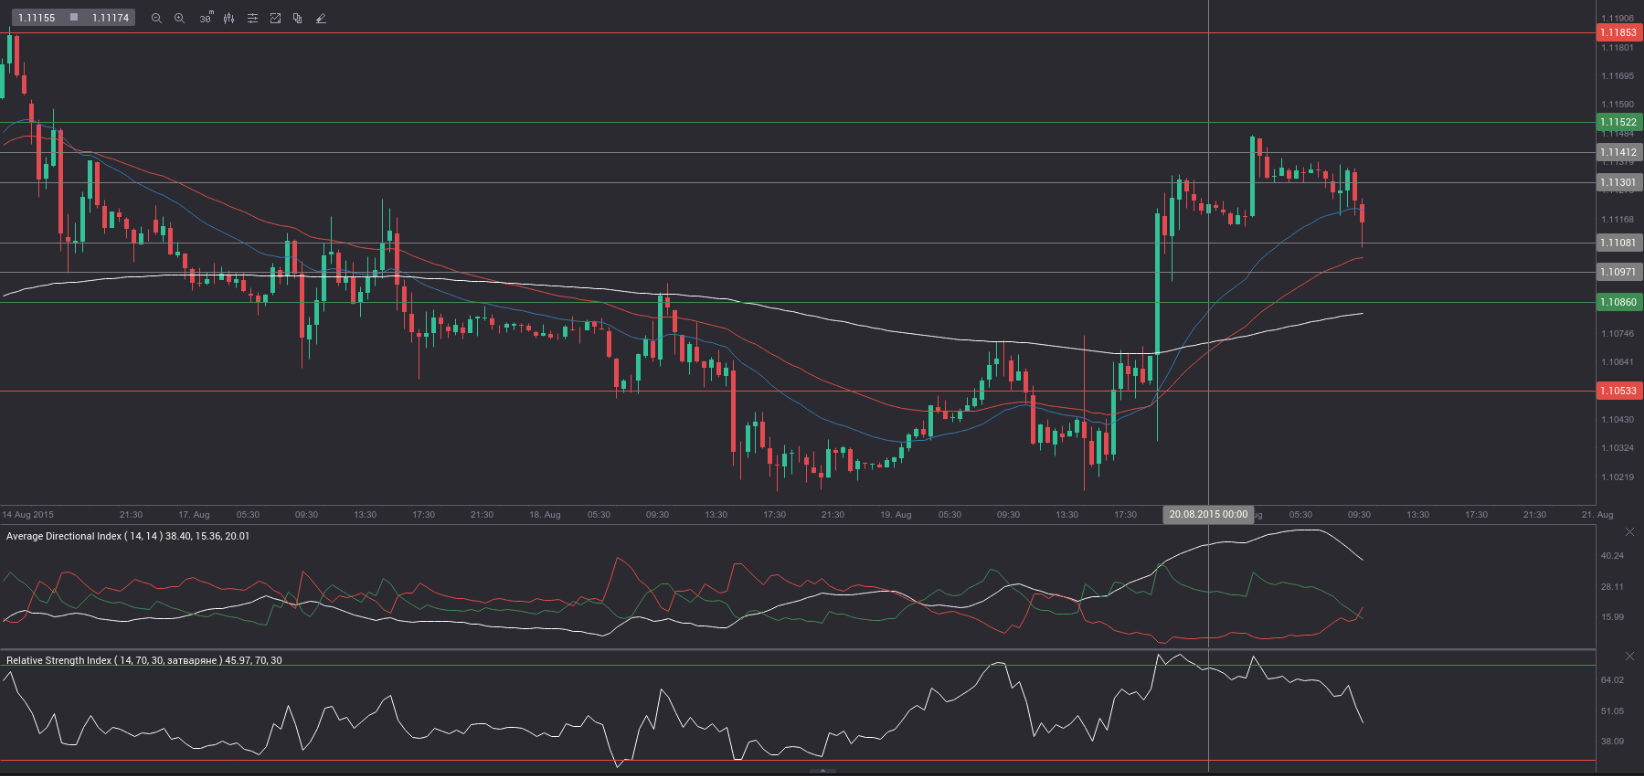
By employing the Camarilla calculation method, the daily pivot levels for EUR/USD are presented as follows:
R1 – 1.1130
R2 – 1.1141
R3 (range resistance – green on the 30-minute chart) – 1.1152
R4 (range breakout – red on the 30-minute chart) – 1.1185
S1 – 1.1108
S2 – 1.1097
S3 (range support – green on the 30-minute chart) – 1.1086
S4 (range breakout – red on the 30-minute chart) – 1.1053
By using the traditional method of calculation, the weekly pivot levels for EUR/USD are presented as follows:
Central Pivot Point – 1.1081
R1 – 1.1238
R2 – 1.1370
R3 – 1.1527
S1 – 1.0949
S2 – 1.0792
S3 – 1.0660