Yesterday’s trade saw USD/JPY within the range of 124.19-124.58. The pair closed at 124.39, ticking up 0.02% on a daily basis. The daily high has also been the highest level since August 13th, when the cross registered a high of 124.64.
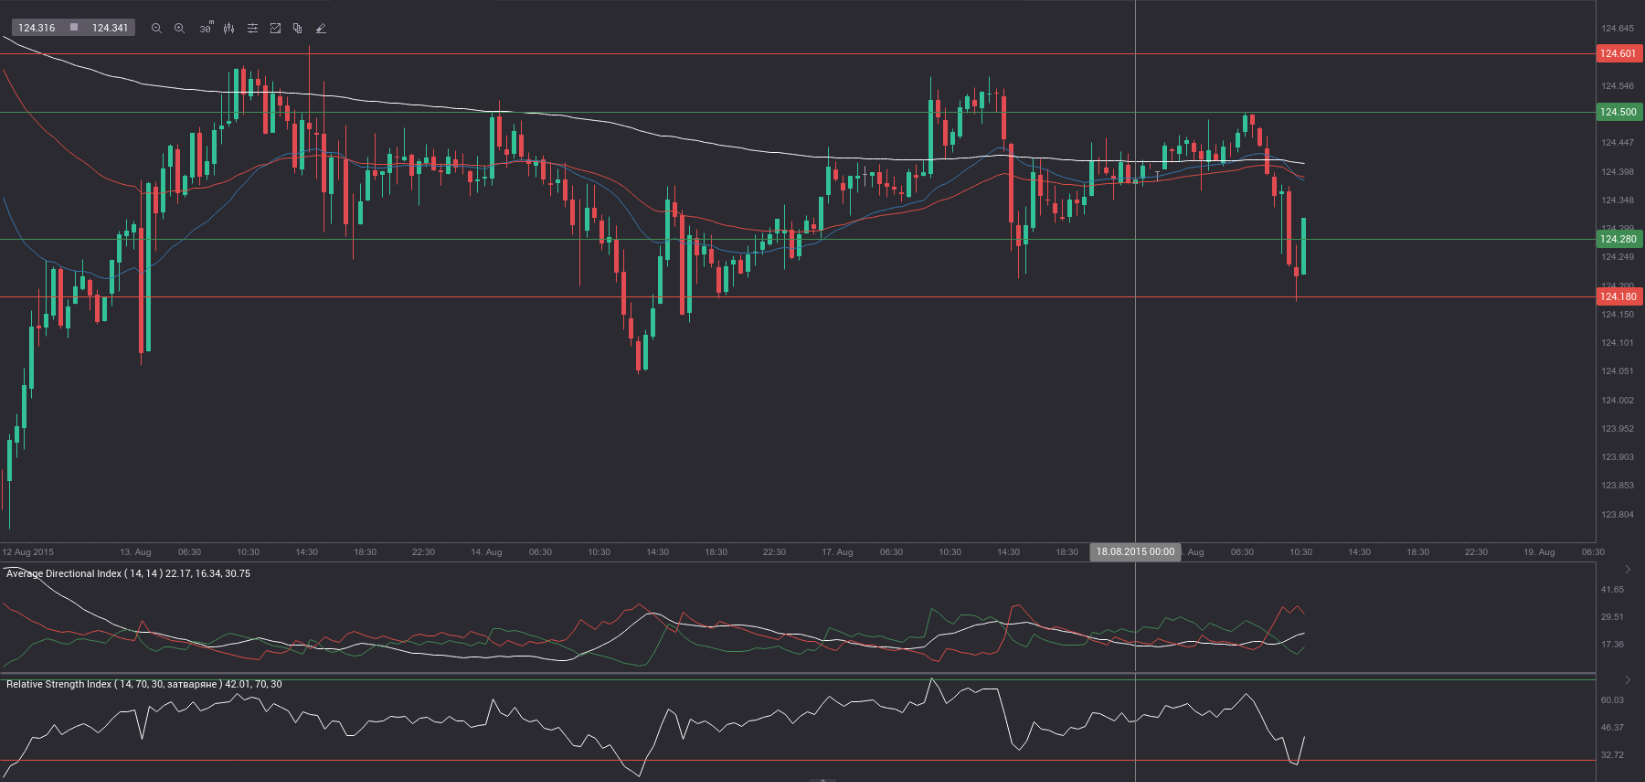
At 8:40 GMT today USD/JPY was down 0.11% for the day to trade at 124.26. The pair tested the lower range breakout level (S4), as it touched a daily low at 124.18 at 8:20 GMT.
Today the cross may be influenced by a number of macroeconomic reports as listed below.
Fundamentals
United States
Housing starts and building permits
The number of housing starts in the United States probably increased a second month in a row in July to reach 1.190 million units, according to market expectations, from the seasonally adjusted annual rate of 1.174 million during the prior month. If so, this would be the highest level since October 2007, when 1.232 million housing starts were reported. Junes increase in housing starts was supported by construction of multi-family houses, including apartments and condominiums, which rose 29.4%. At the same time, construction of single-family houses shrank 0.9% to 685 000 units during the same month, according to the report by the US Census Bureau. The rate for units in buildings with five units or more was 476 000 in June.
Housing starts represent a gauge to measure residential units, on which construction has already begun every month. A start in construction is defined as the foundation laying of a building and it encompasses residential housing primarily.
The number of building permits in the country probably decreased to 1.232 million in July from an annual level of 1.343 million in June. The latter has been the highest number of permits since July 2007, when a level of 1.389 million was reported. Single-family authorizations rose at a monthly rate of 0.9% to 687 000 units in June, while authorizations of units in buildings with five units or more were reported at 621 000.
Building permits are permits, issued in order to allow excavation. An increase in the number of building permits and housing starts usually occurs a few months after mortgage rates in the country have been reduced. Authorizations are not required in all regions of the United States. Building permits, as an indicator, provide clues in regard to demand in the US housing market. In case a lower-than-anticipated figure is reported, this will trim demand for the US dollar. The official housing data is due out at 12:30 GMT.
Japan
Merchandise Trade Balance
The gap on Japan’s merchandise trade balance probably narrowed to JPY 56.7 billion during July, according to the median forecast by experts, from a deficit of JPY 69.0 billion, registered in June. If so, this would be the fourth consecutive month of deficit, but on the other hand, it would be the smallest figure since March, when a trade gap of JPY 53.4 billion was reported.
Total exports rose at an annualized rate of 9.5% year-on-year to reach JPY 6,505.74 billion in June. Within the category, shipments to the United States rose the most (+17.6%), followed by sales to the Middle East (+13.9%). In addition, exports to Asia, which account for more than half of the countrys total exports, went up 10.1%, as shipments to India grew 17.3%, those to China rose 5.9%, to Hong Kong (+21.6%), to Singapore (+29.2%), to Taiwan (+14.8%), to South Korea (+9.5%) and to Vietnam (+38.7%).
At the same time, total imports dropped 2.9% year-on-year to JPY 6,574.79 billion in June. Inbound shipments were lower for raw materials (-2.6%) and for mineral fuels (-33.4%). Imports of foodstuffs went up 9.1%, those of chemicals increased 17.5%, of manufactured goods (+8.0%), of machinery (+8.5%) and of transport equipment (+31.6%).
During the period 1970-2010 Japan has had regular annual trade surpluses. Since 2011, on the other hand, the country has been recording trade deficits, because yen depreciation led to higher costs of imports, while increased purchases of fossil fuels and gas were aimed to neutralize the loss of nuclear power after the devastating earthquake and the tsunami in March 2011.
In case a smaller-than-expected trade deficit is reported, this will usually bolster demand for the yen. The Ministry of Finance will release the official trade data at 23:50 GMT.
Bond Yield Spread
The yield on Japanese 2-year government bonds went as high as 0.009% on August 17th, after which it closed at the same level to advance 0.003 percentage point on a daily basis.
The yield on US 2-year government bonds climbed as high as 0.730% on August 17th, after which it fell to 0.706% at the close to lose 2 basis points (0.02 percentage point) for the day.
The spread between 2-year US and 2-year Japanese bond yields, which reflects the flow of funds in a short term, shrank to 0.697% on August 17th from 0.720% on August 14th. The August 17th yield spread has been the lowest one since August 12th, when the difference was 0.663%.
Meanwhile, the yield on Japan’s 10-year government bonds soared as high as 0.400% on August 17th, or the highest level since August 11th (0.420%), after which it slid to 0.380% at the close to remain unchanged compared to August 14th.
The yield on US 10-year government bonds climbed as high as 2.201% on August 17th, after which it slipped to 2.164% at the close to lose 3.7 basis points (0.037 percentage point) on a daily basis. It has been the first drop in the past four trading days.
The spread between 10-year US and 10-year Japanese bond yields narrowed to 1.784% on August 17th from 1.821% on August 14th. The August 17th yield difference has been the lowest one since August 12th, when the spread was 1.782%.
Daily and Weekly Pivot Levels
By employing the Camarilla calculation method, the daily pivot levels for USD/JPY are presented as follows:
R1 – 124.43
R2 – 124.46
R3 (range resistance – green on the 30-minute chart) – 124.50
R4 (range breakout – red on the 30-minute chart) – 124.60
S1 – 124.35
S2 – 124.32
S3 (range support – green on the 30-minute chart) – 124.28
S4 (range breakout – red on the 30-minute chart) – 124.18
By using the traditional method of calculation, the weekly pivot levels for USD/JPY are presented as follows:
Central Pivot Point – 124.46
R1 – 125.15
R2 – 125.99
R3 – 126.68
S1 – 123.62
S2 – 122.93
S3 – 122.09