Yesterday’s trade saw EUR/USD within the range of 1.1079-1.1189. The pair closed at 1.1149, dipping 0.07% on a daily basis, or the first loss in the past four trading days. On Wednesday the cross went as high as 1.1214, or a level unseen since July 10th.
At 7:10 GMT today EUR/USD was up 0.09% for the day to trade at 1.1159. The pair is set to test the range resistance level (R3), as it touched a daily high at 1.1172 at 7:13 GMT.
Today the cross may be influenced by a number of macroeconomic reports as listed below.
Fundamentals
Euro area
Italian Gross Domestic Product – preliminary estimate
The preliminary estimate of Italys annual Gross Domestic Product probably pointed to a 0.5% expansion in the second quarter of the year, according to the median forecast by experts. In Q1 economy grew at an annualized pace of 0.1%, according to final data, released on May 29th. Q1 2015 has been the first quarter of positive growth in the past 15 quarters.
On a quarterly basis, Italian economy probably expanded 0.3% in Q2, following another growth rate of 0.3% during the first quarter. Q1 2015 has marked the first GDP expansion since mid-2013, as it was driven mostly by investment activity, while private consumption and net external demand had a negative contribution. In Q1, gross fixed capital formation has been the main driver of growth (+1.5%), mainly because of the increase in investment in construction (+0.5%) and transport equipment (+28.7%). Household consumption contracted 0.1% in Q1, exports marked zero growth, while imports surged 1.4%.
In case a faster-than-projected rate of growth was reported, this would have a moderate bullish effect on the single currency. The National Institute of Statistics (Istat) will release the preliminary GDP data at 8:00 GMT.
Euro area consumer inflation – final estimate
The final annualized consumer inflation in the Euro zone, evaluated in accordance with Eurostat’s harmonized methodology, probably confirmed the preliminary rate at 0.2% in July, which was reported on July 31st. If so, this would be the third straight month, when annual consumer inflation inhabited positive territory. In June the final HICP reading also pointed to annual inflation rate of 0.2%, which matched the preliminary estimate. According to the preliminary data, in July the rate is expected to be influenced the most by cost of services (a 1.2% increase year-on-year, following a 1.1% gain in the prior month), cost of food, alcohol and tobacco (up 0.9% year-on-year, following a 1.1% gain in June), cost of non-energy industrial goods (up 0.5%, following a 0.3% gain in June) and cost of energy (down 5.6% year-on-year, following another 5.1% drop in the preceding month).
The index shows the change in price levels of a basket of goods and services from consumer’s perspective and also reflects purchasing trends. The main components of the HICP are food, alcohol and tobacco (accounting for 19% of the total weight), energy (11%), non-energy industrial goods (29%) and services (41%).
The HICP is used to evaluate and compare inflation rates between Member States, according to Art. 121 of the Amsterdam’s Agreement and directives by the European Central Bank (ECB), in order the latter is enabled to maintain price stability and to implement monetary policy. The HICP aggregates are calculated as a weighted average of each member state’s HICP components.
In case the HICP rose more than anticipated, thus, further approaching the 2% inflation objective set by the ECB, this would support demand for the euro, because it implies that monetary policy measures have begun to work in favor of economic activity.
The final annualized Core HICP for July probably accelerated to 1.0%, up from a preliminary core inflation estimate of 0.9%, which was reported on July 31st. If so, this would be the highest annual core inflation since April 2014, when a final annual rate of 1.0% was reported. In June the final annualized core inflation in the Euro area was registered at 0.8%, in line with the preliminary reading. This index excludes volatile categories such as food, energy, alcohol and tobacco. Eurostat is scheduled to release the final inflation data at 9:00 GMT.
Euro area Gross Domestic Product – preliminary release
The seasonally adjusted preliminary Gross Domestic Product in the Euro zone probably expanded at an annualized rate of 1.3% during the second quarter of 2015, according to expectations, following another 1.0% increase of the GDP in the first quarter, according to final data. If so, this would be the fastest annual rate of growth since Q3 2011, when the regions economy expanded 1.4%.
The preliminary GDP during Q2 compared to the first quarter probably showed a 0.4% expansion, or the same rate of growth as in Q1.
Household final consumption accounted for 0.3 percentage points of growth both in the euro zone and the EU28, as it expanded 0.5% in Q1 in both zones. Gross fixed capital formation accounted for 0.2 percentage points, rising 0.8% in Q1 in both the euro zone and the EU28. The contribution of the external balance was negative for both zones, while the contribution of changes in inventories was positive. Sales surged 0.6% in both the euro area and the EU28, while imports rose 1.2% in the euro area and 1.4% in the EU28, according to the report by Eurostat.
In case economic growth in the single currency zone exceeded expectations, this would certainly boost the euro. Eurostat is expected to release the preliminary GDP report at 9:00 GMT.
United States
Producer prices
Annual producer prices in the United States probably fell for a sixth month in a row in July, by 0.9%, according to the median estimate by experts. In June the annualized Producer Price Index decreased 0.7%. This index reflects the change in prices of over 8 000 products, sold by manufacturers during the respective period. The Producer Price Index (PPI) differs from the Consumer Price Index (CPI), which measures the change in prices from consumer’s perspective, due to subsidies, taxes and distribution costs of different types of manufacturers in the country. The simple logic behind this indicator is that if producers are forced to pay more for goods and services, they are more likely to pass these higher costs to the end consumer. Therefore, the PPI is considered as a leading indicator of consumer inflation. In case annual producer prices fell at a sharper rate than anticipated, this would usually have a bearish effect on the greenback.
The nation’s annualized core producer price inflation, which excludes prices of volatile categories such as food and energy, probably slowed down to 0.5% in July from 0.8% in the prior month. If so, this would be the lowest annual rate of increase in the PPI in at least 8 years. This indicator is quite sensitive to changes in aggregate demand, thus, it can be used as a leading indicator for economy. However, because of its restrained scope, it is not suitable for future inflation forecasts. The Bureau of Labor Statistics is expected to report on the official PPI performance at 12:30 GMT.
Industrial production, Capacity Utilization
Industrial output in the United States probably expanded 0.3% in July compared to June, following a revised down monthly growth rate of 0.2% in June (0.3% previously). Manufacturing production shrank 0.1% in June, after being reported as unchanged in the initial estimate. The index for mining went up 1.0% in June, due to an increase in crude oil extraction. The output of utilities rose 1.5% in June compared to a month ago.
The index of industrial production reflects the change in overall inflation-adjusted value of output in the three major sectors mentioned above. The index is sensitive to consumer demand and interest rates. As such, industrial production is an important tool for future GDP and economic performance forecasts. Those figures are also used to measure inflation by central banks as very high levels of industrial production may lead to uncontrolled levels of consumption and rapid inflation. It is a coincident indicator, which means that changes in its levels generally echo similar shifts in overall economic activity. A larger-than-projected increase in the index would usually boost demand for the US dollar.
The Board of Governors of the Federal Reserve is to release the production data at 13:15 GMT.
In addition, Capacity Utilization rate in the country probably decreased to 78.0% in July from 78.4% in June. If so, this would be the lowest utilization rate since August 2013, when a rate of 77.9% was reported. This indicator represents the optimal rate for a stable production process, or the highest possible level of production in an enterprise, in case it operates within a realistic work schedule and has sufficient raw materials and inventories at its disposal. High rates of capacity utilization usually lead to inflationary pressure. In general, lower-than-anticipated rates tend to have a limited bearish effect on the US dollar.
Bond Yield Spread
The yield on German 2-year government bonds went as high as -0.267% on August 13th, or the highest level since August 11th (-0.265%), after which it slid to -0.276% at the close to gain 0.003 percentage point on a daily basis. It has been the first gain in the past six trading days.
The yield on US 2-year government bonds climbed as high as 0.717% on August 13th, or the highest level since August 11th (0.729%), after which it closed at the same level to gain 4.8 basis points (0.048 percentage point) for the day. It has been the first gain in the past three trading days.
The spread between 2-year US and 2-year German bond yields, which reflects the flow of funds in a short term, expanded to 0.993% on August 13th from 0.948% during the prior day. The August 13th spread has been the most notable one since August 10th, when the difference was 0.998%.
Meanwhile, the yield on German 10-year government bonds soared as high as 0.661% on August 13th, or the highest level since August 11th (0.679%), after which it slid to 0.637% at the close to appreciate 3.2 basis points (0.032 percentage point) compared to August 12th. It has been the first gain in the past three trading days.
The yield on US 10-year government bonds climbed as high as 2.198% on August 13th, or the highest level since August 11th (2.232%), after which it slipped to 2.185% at the close to add 3.7 basis points (0.037 percentage point) on a daily basis, while marking a second consecutive day of gains.
The spread between 10-year US and 10-year German bond yields widened to 1.548% on August 13th from 1.543% during the prior day. The August 13th yield difference has been the largest one since August 4th, when the spread was 1.587%.
Daily and Weekly Pivot Levels
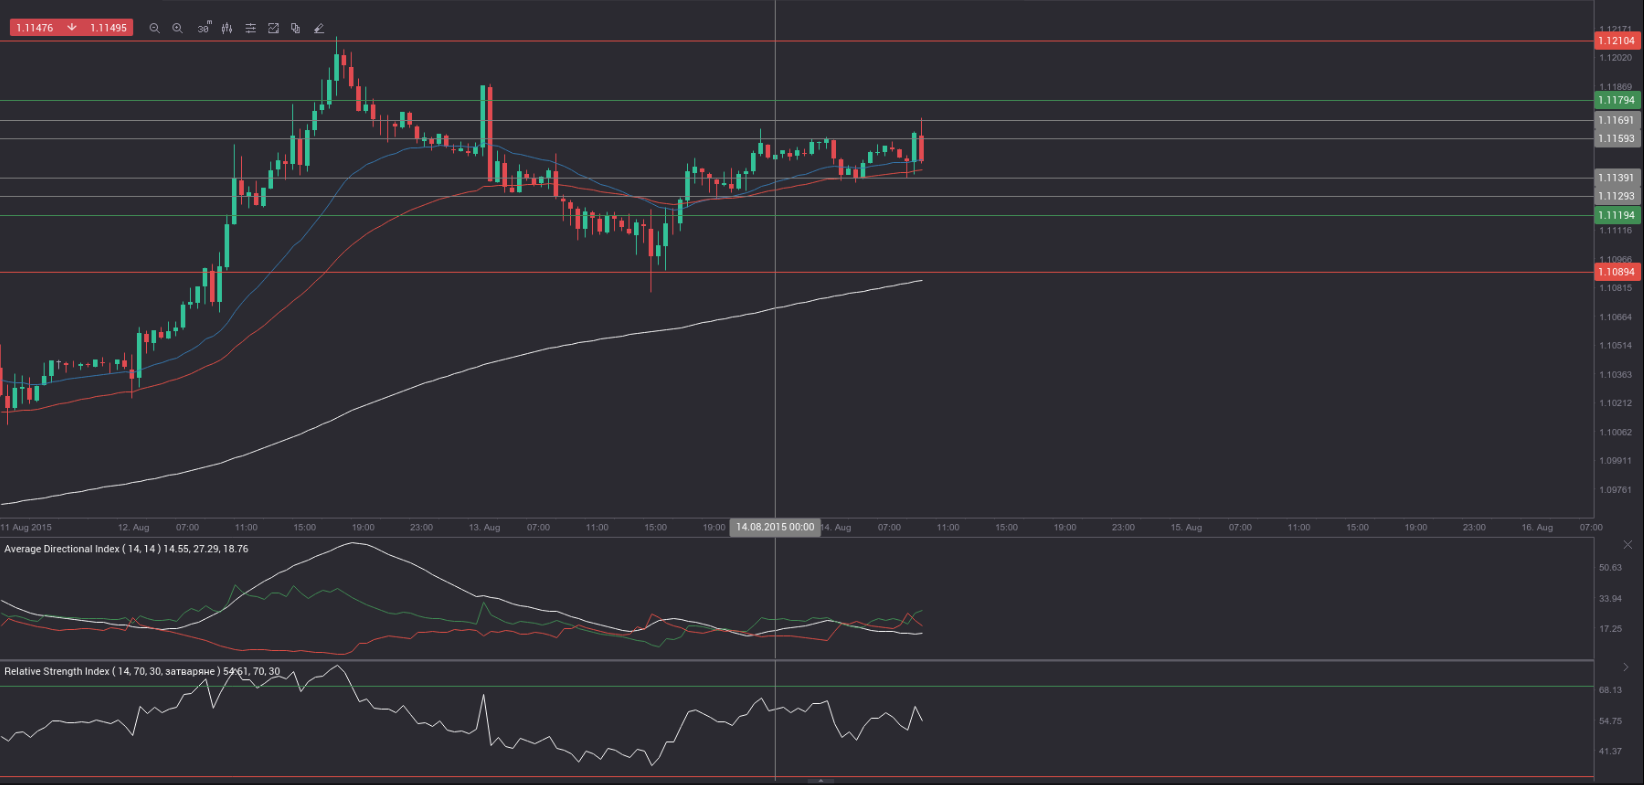
By employing the Camarilla calculation method, the daily pivot levels for EUR/USD are presented as follows:
R1 – 1.1159
R2 – 1.1169
R3 (range resistance – green on the 30-minute chart) – 1.1179
R4 (range breakout – red on the 30-minute chart) – 1.1210
S1 – 1.1139
S2 – 1.1129
S3 (range support – green on the 30-minute chart) – 1.1119
S4 (range breakout – red on the 30-minute chart) – 1.1089
By using the traditional method of calculation, the weekly pivot levels for EUR/USD are presented as follows:
Central Pivot Point – 1.0938
R1 – 1.1029
R2 – 1.1089
R3 – 1.1180
S1 – 1.0878
S2 – 1.0787
S3 – 1.0727