Trading flag and pennant formations
This lesson will cover the following
- Pennant formations
- Flag formations
- How to trade them
We have already discussed flag and pennant formations in the article “Flags and Pennants Price Pattern” in our “Forex Trading Guide“, so we will briefly summarise what these patterns are and quickly move on to the trading strategy.
Flags and pennants are both predominantly continuation patterns, each starting with a sharp initial move (we will call it a flagpole) followed by a consolidation period. The price then usually breaks out in the direction of the flagpole, thus rendering them continuation formations. As shown in the article “Flags and Pennants Price Pattern“, the main difference between the two is that the pennant’s consolidation period resembles a triangle (the two boundaries slope towards each other and will eventually converge), whereas a flag consists of two parallel lines that together slope away from the flagpole.
Pennant pattern
 Let us delve into the specifics of the pennant pattern. As we said, it comprises two elements: an almost vertical climactic bar (the flagpole) followed by a zone of sideways trading – the consolidation area (most often a symmetrical triangle).
Before entering a trade based on this formation, you of course need to have a predetermined entry point, stop-loss and profit target. The first step is to measure the height of the flagpole. After the price has entered the consolidation area (which allows for the measurement of the flagpole), we set our entry point at 10% of its height above its highest point. This should help filter out any false breakouts from the formation.
- Trade Forex
- Trade Crypto
- Trade Stocks
- Regulation: NFA
- Leverage: Day Margin
- Min Deposit: $100
Our stop-loss should be 25% of the flagpole’s height and is placed below the entry point, thus 15% below the flagpole’s high. This will protect you from a potential failure of the pattern’s continuation nature.
As for the profit target, we will be using a scale-out strategy. Our first profit target is the amount risked, i.e. 25% of the flagpole’s height. As soon as it is reached, we take out half of our position and move our stop up to the entry point. This leaves us with a profit of 25% of the flagpole’s height on the first portion of the trade, while the remainder may drop to breakeven in the worst-case scenario.
The profit target for the remainder of our position will be equal to the length of the flagpole, starting from its top (page 176), i.e. 90% of the flagpole’s length up from the entry point (the 10% difference comes from the entry point being 10% of the flagpole’s height above its high).
Example
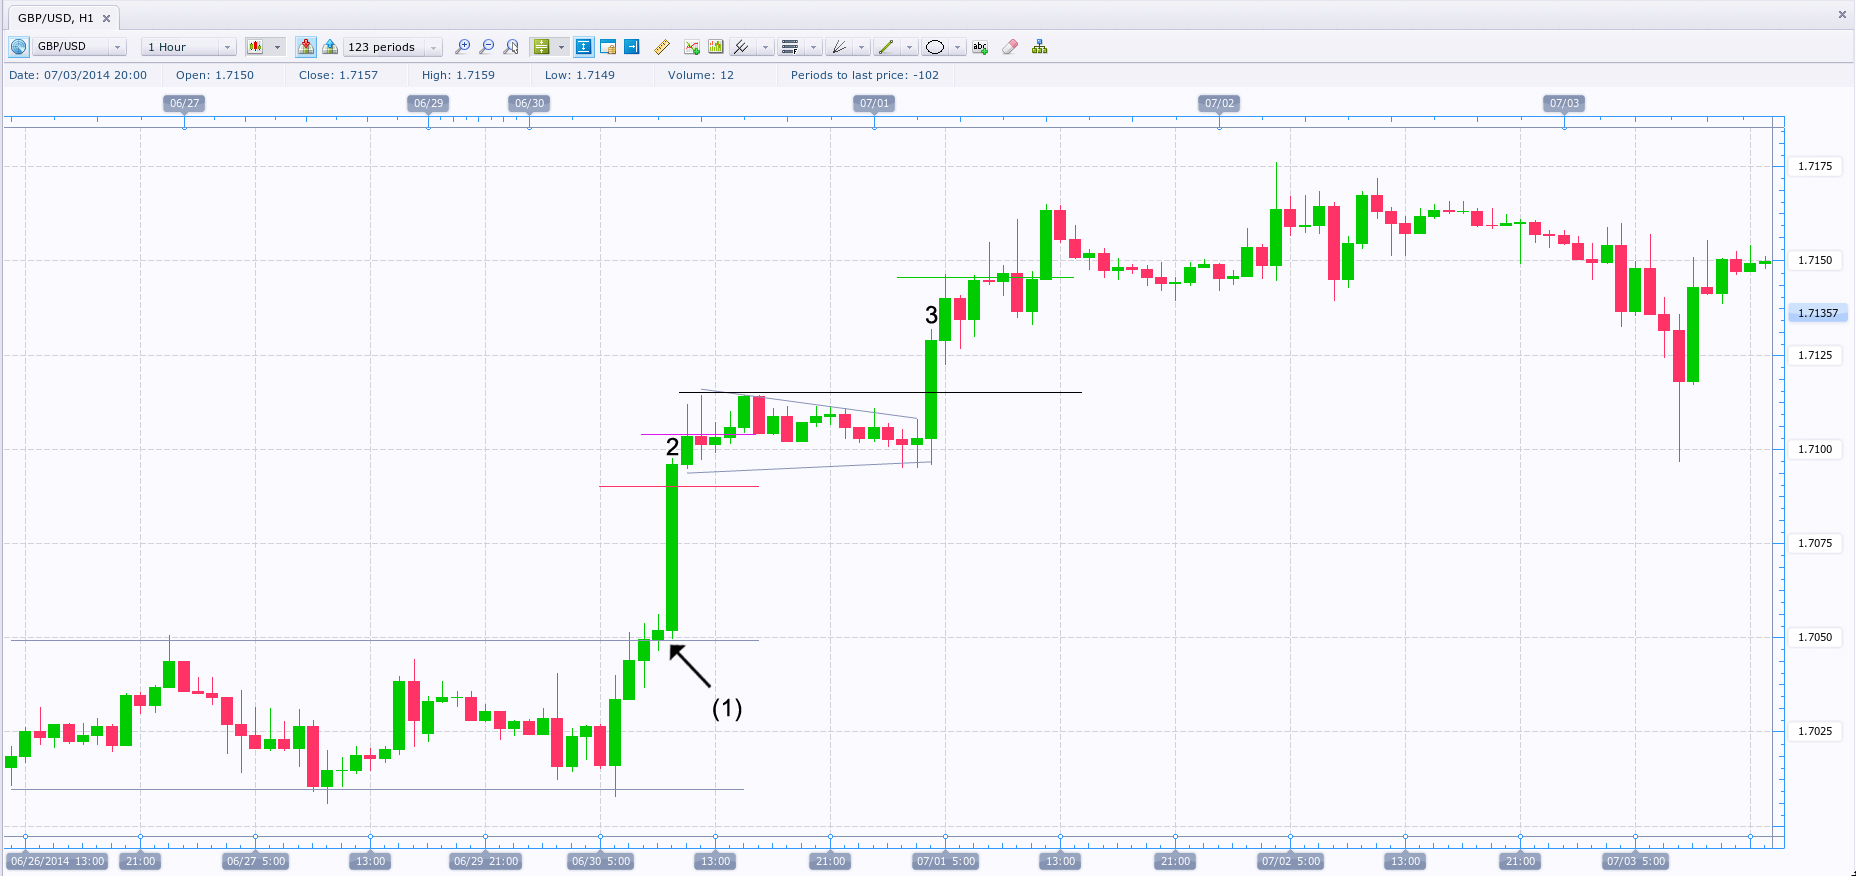
For the screenshot above we have used an hourly chart of the GBP/USD cross. The market broke out of an established trading range at (1) and formed a flagpole (bar 2).
Once the price action later entered a consolidation area and started resembling a flag/pennant formation, we began to calculate the pattern’s elements in order to position ourselves accordingly.
The flagpole’s high is at 1.7098 US dollars and its height is 48 pips. Thus, we enter at 10% of its height above the high (around 5 pips), at 1.7103, as marked by the purple horizontal line. Our stop is placed 25% of the pole’s height below the entry (or 15% beneath its high – 7.2 pips), at 1.7091, visualised by the red horizontal line.
Our final profit target is 100% of the flagpole’s height extended above its high (or 90% above the entry point), thus at 1.7146 US dollars, marked by the green horizontal line.
However, we said we would be scaling out of the trade as soon as we earned the amount risked. This means that when the price rises by 25% of the flagpole’s height, projected from the entry point, we will exit half of our position and move our stop to breakeven. The initial profit target was reached at 12 pips above the entry level, or at 1.7103 + 0.0012 = 1.7115 US dollars, visualised by the black horizontal line. It was hit at bar 3. We then exited half of our position and moved our stop-loss to breakeven, before our final profit target was reached shortly after.
Flag pattern
 Like pennants, flags also begin with a very strong initial move, followed by a consolidation area. The climactic bar that forms reflects the bulls’ dedication to buy, disregarding the price they are paying – they just want to be in the market at all costs. Such a move is often triggered by a major economic indicator, interest-rate decision, etc.
After the initial spike, some bulls lock in profits, which allows bears to try to bring the price down, but in many cases they will not possess enough selling power to overcome the bulls, which will eventually lead to the upward breakout and trend continuation.
Due to the two patterns’ similarities in formation and outcome, they are traded in an analogous manner. Again, we first need to measure the flagpole’s height. The entry point is at a distance equal to 10% of its height above the high of the flagpole. The calculation and placement of the stop-loss level are also identical to the pennant pattern – the stop is placed 25% of the flagpole’s height below the entry point (or 15% of the height below the flagpole’s highest point).
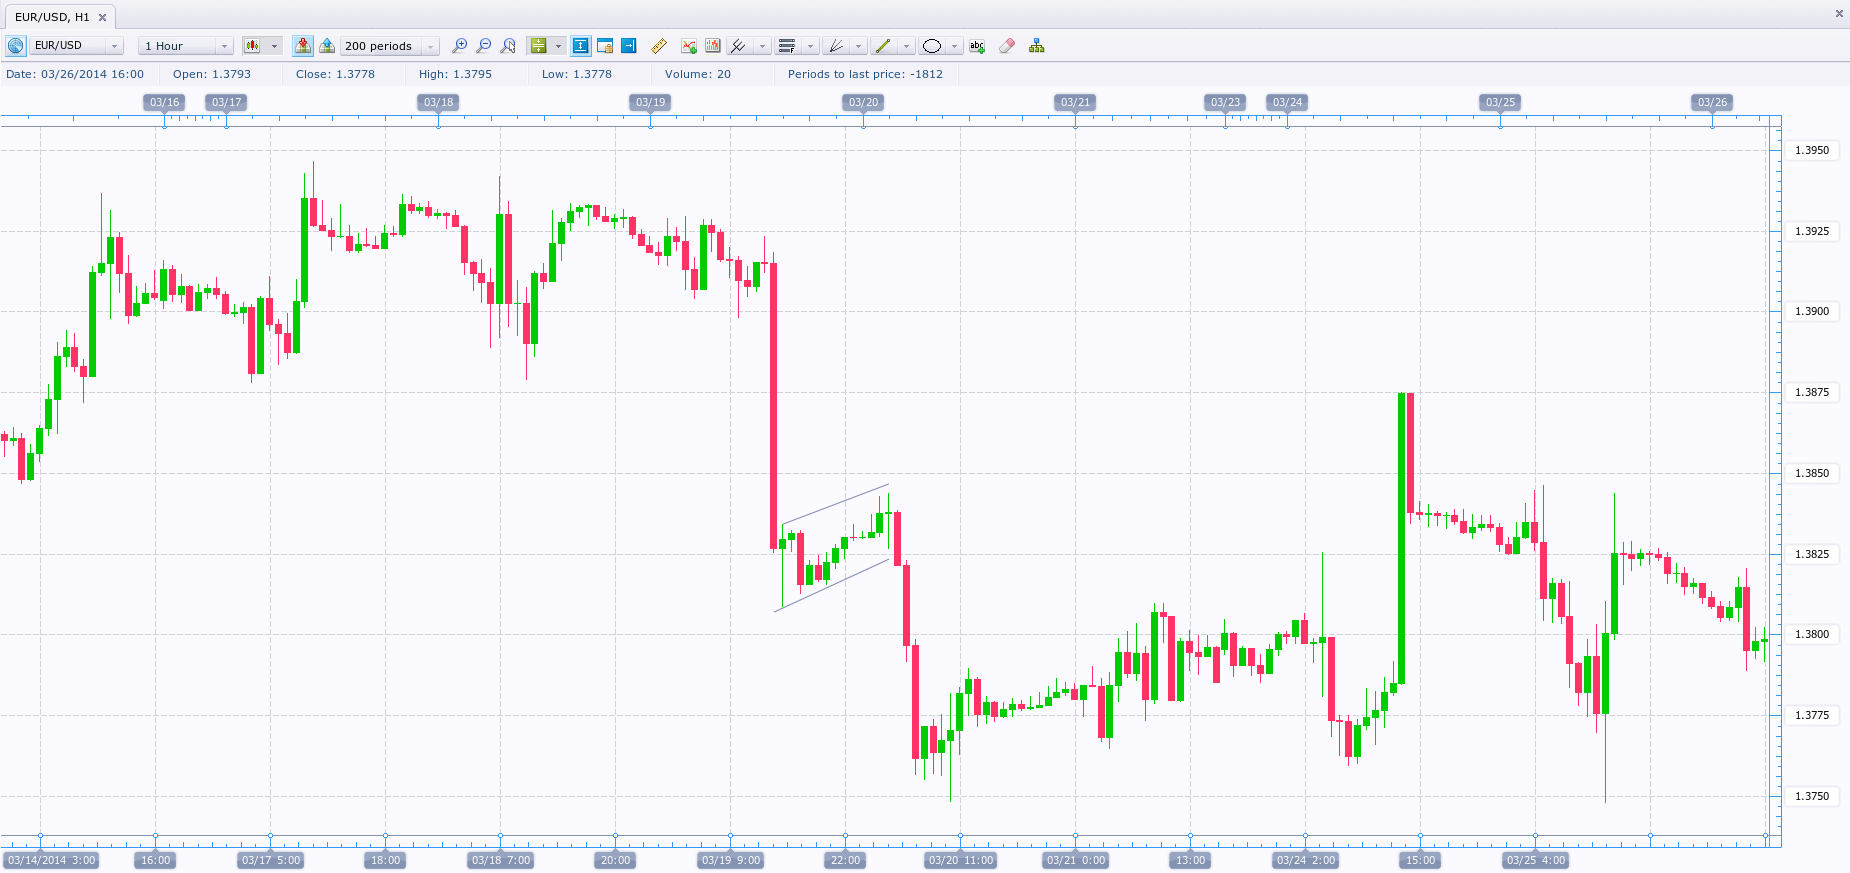
Once again, our first profit target is equal to the amount risked, projected up from the entry point (25% of the flagpole’s height). As soon as it is reached, we exit half of our position and move our stop-loss to the breakeven level (entry point), so that in the worst-case scenario we are left with the profit from the first part of the trade. Once that is done, we aim for the second profit target, which again is equal to 100% of the flagpole’s height, projected up from its highest point (90% of its high projected up from the entry point). On the screenshot below you can see a reversed flag formation.
Rules are important
 In order to improve our chances of success with both patterns, it is crucial to follow the entry and stop-loss guidelines we underscored earlier. It is of utmost importance to respect the entry rules to filter out potentially losing trades. In the example below, you can see how a potential flag formed a flagpole, but an early entry at the high of the flagpole, disregarding our established entry rule, would have triggered our stop.
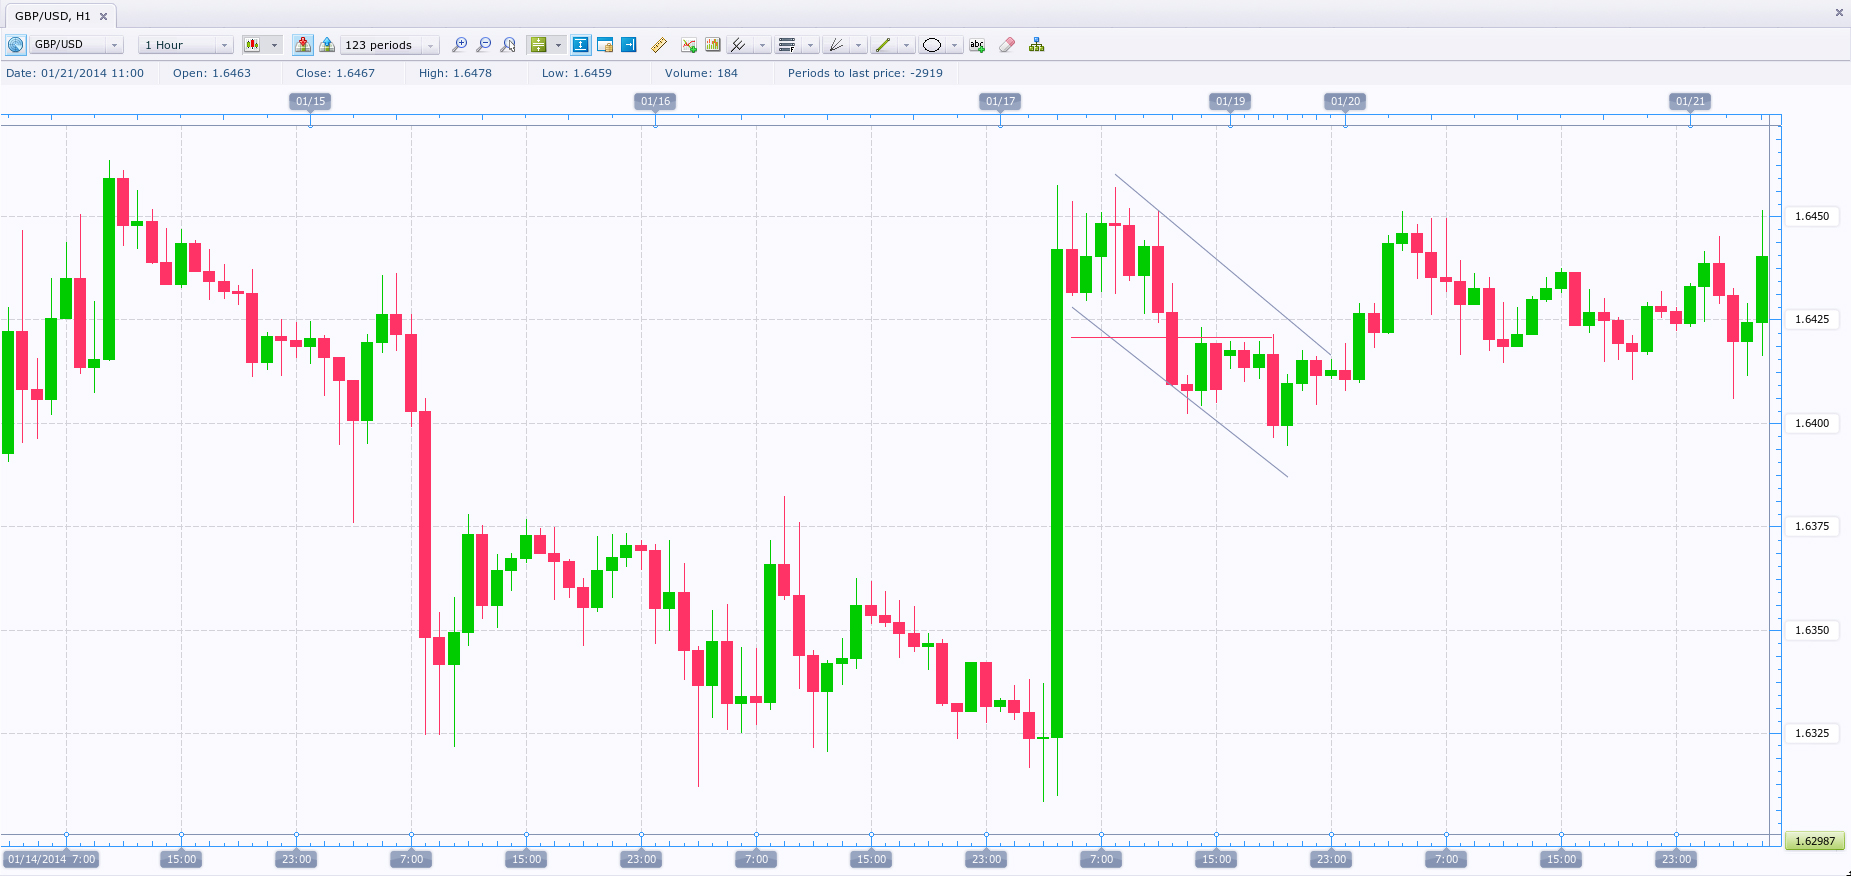
The flagpole’s high and low were at 1.6458 and 1.6310 respectively, thus its height was approximately 148 pips. According to our strategy, we should have entered at 10% of that amount above the high itself, but the market initially failed to rally to that point, so you should abstain from going long.
However, if a trader were so eager to hop into the market at the high of the flagpole that he ignored the entry rule, he could not filter out potential failed flags. Say he entered at the flagpole’s high and placed a stop-loss equal to 25% of its height beneath the entry point at 1.6421 USD (1.6458 USD − 0.0148 USD × 0.25). It is visualised by the red line, and as you can see it was hit, rendering the trade a loser.