Trading failed breakouts at session open
The failed breakout strategy we are about to explain and test is based on such currencies and is applied on a 15-minute time frame.
This lesson will cover the following
- Trading sessions
- Fading breakouts at session open
- Steps to follow
As we know, unlike the stock market, which closes each day and reopens the next, the foreign exchange market operates around the clock apart from the weekend, and it does not have such pronounced opening sessions. For example, the shares of a company that releases vital information after the stock market has closed will most likely gap when the market reopens the next day and will, at least initially, make a very strong move. This opens up many possibilities for traders to enter the market and deploy their trading strategies.
Although the Forex market does not close during the working week, it tends to display similar, albeit much more muted, behaviour in the transition between the different trading sessions as major market participants (such as banks) begin their working day and join the market. If you want to learn more about the different trading sessions and their characteristics, read our article “Trading Sessions“, as well as the following three lessons, which provide individual information for each of them.
- Trade Forex
- Trade Crypto
- Trade Stocks
- Regulation: NFA
- Leverage: Day Margin
- Min Deposit: $100
By now you should know that European trading accounts for the largest volume. Thus, you can expect the market to spike and break out during the transition between the Asian and European sessions. In general, the currencies with the most traded volume are those of the countries that participate in a given trading session. Thus, the Japanese yen will be traded most during the Asian session, while European currencies such as the euro, British pound, Swiss franc, etc., and the US dollar and Canadian dollar will be traded most during the European and US sessions, respectively. Additional volume is seen during the overlap of the trading sessions; thus, for example, the EUR/JPY cross will see the most volatility when the two respective sessions converge. Don’t forget to aim for the most liquid crosses.
Trading steps
 The failed breakout strategy we are about to explain and test is based on such currencies and is applied on a 15-minute time frame. However, there are several conditions that must be met before you consider using it.
First of all, the market needs to be calm prior to the session transition, ideally within a definable trading range. This trading range and the possible breakout when the next session opens are what we will be looking for.
Second, because trading volume spikes, a breakout is very likely to occur, but at first we must not do anything. It would be best if the breakout is small – up to 20-30 pips, or at most a third of the average daily range. If the breakout is larger than that, i.e., greater than 40-45 pips, do not take the trade, as it has a greater chance of following through. Even if a reversal pattern forms, you should still avoid entering in its direction, as it has a higher chance of bouncing off the previous resistance, which now acts as support, and generating a second entry signal.
If the scenario plays out as described above, we have everything set for an entry in the opposite direction, provided we get a reversal bar pattern. Read more about reversal bar patterns in our article “Bars signalling reversal – basic features“, as well as the following six articles.
 Once we see that a reversal pattern indicates a possible shift in price movement, we enter in the direction of the pattern: below its low if it is bearish, or above its high if it is bullish.
The stop should be placed on the opposite side of the pattern – below its low for a long entry or above its high for a short position. As for the exit, you can either use a trailing stop with a fixed or percentage value, or you can exit when a new reversal bar pattern forms in the opposite direction of your trade.
Your trade stands a better chance of being a winner if you enter in the direction of the longer-term trend. You can switch to a higher timeframe (hourly or larger) and enter only trades parallel to the general trend. This way the breakout you are fading will be against the general trend, bringing the odds in your favour.
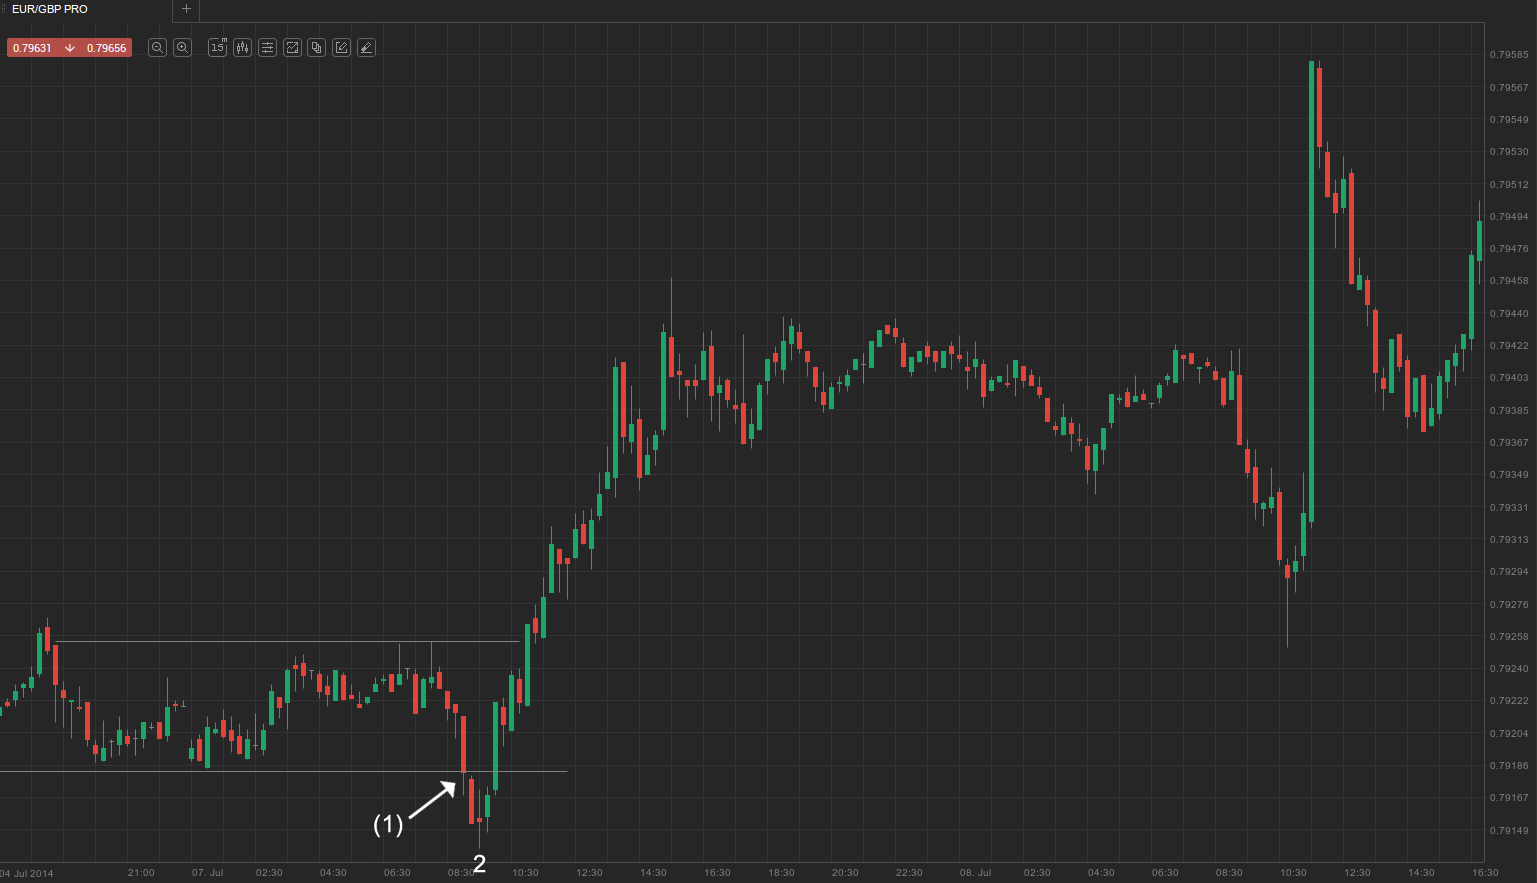
In the screenshot above, we used a 15-minute EUR/GBP chart. A suitable entry point was presented here, but keep in mind that the general trend was bearish, so for the example we will disregard the suggestion above to consider entering predominantly in the direction of the longer-term trend. The low that was hit represented the weakest level since October 2012.
As you can see, the market was in a tight consolidation area during the Asian trading session. As European players began to join the market, it broke below the support line at (1) at 0.7918 and fell to a 22-month low of 0.7914.
However, there was no follow-through selling, as the multi-month low acted as strong support, which rendered the minor breakout a failure. A sign of waning momentum was the doji bar 2, which was followed by a bull trend bar and generated a long entry signal. We enter above the high of the doji bar at 0.7917, while placing a stop 5-10 pips below its low at 0.7904 pounds.
As the price moves higher, we trail our stop. It can be adjusted by using either an absolute number of pips or a percentage basis. You can also trail it higher beneath the low of each closed bar whose high extends to a new swing high. Alternatively, as soon as you achieve a profit of 100% of the amount risked, you can scale out of half your position and move your stop to break-even, while leaving the other portion on the market until you reach double the amount risked.