Squeezing pips from ranging markets via RSI
This lesson will cover the following
- Relative Strength Index
- Using RSI to determine reversal points
- Trade rules and examples
The strategy we are about to discuss is fairly simple and uses the Relative Strength Index to help you determine where price movement is expected to reverse. It is most effective during sideways trading, when the indicator’s extreme levels (overbought and oversold) more effectively indicate reversal points.
We will be using a daily timeframe, but it can work on smaller charts as well. This strategy is somewhat different from the usual RSI overbought-oversold approach because it involves the formation of a reversal bar, which signals exhaustion in the current price movement. Also, due to this strategy’s exit rules, the trader will almost always be in the market (we will discuss this a bit later). Here is how the trade works.
In order for an entry signal to be generated, the RSI must be in either the overbought or oversold zone (we will use the default settings of 70 and 30, respectively). Therefore, if we are aiming at a long trade, the RSI needs to be in the oversold zone (below 30). A price reversal should be confirmed by the close of a bullish bar, accompanied by the indicator rising above 30. As soon as the bullish candle closes, you need to enter a long position at the open of the next candle.
- Trade Forex
- Trade Crypto
- Trade Stocks
- Regulation: NFA
- Leverage: Day Margin
- Min Deposit: $100
Stop-loss and profit target
 Your stop-loss should be placed several pips beneath the most recent swing low in order to avoid random noise triggering it. As for the profit target, you should lock in profits in two increments; i.e., you should scale out. Half of the position should be closed as soon as the price rises by 50% of the risk. Thus, if the protective stop is 30 pips below the entry, you should close half the position as the price rises by 15 pips. At that point you should also move the stop-loss to breakeven, so the worst-case scenario for your trade becomes a 15-pip win instead of the initial 30-pip loss.
The remainder of the position is automatically closed if the stop-loss at breakeven is hit. Alternatively, you should exit the market if the RSI enters the overbought area (above 70), reverses, and crosses back below 70.
The latter scenario is an advantage of this trading strategy compared with most other RSI systems because it is designed to extract the maximum from market fluctuations. Because the RSI leaving the overbought area is not only a long-trade exit point but also a signal for a short entry, the trader closes the long position and immediately enters short. Thus, most of the time the trader remains in the market. The only time the trader is out of the market is when the remainder of the position is stopped at breakeven or when a false entry signal is stopped out. See the following example.
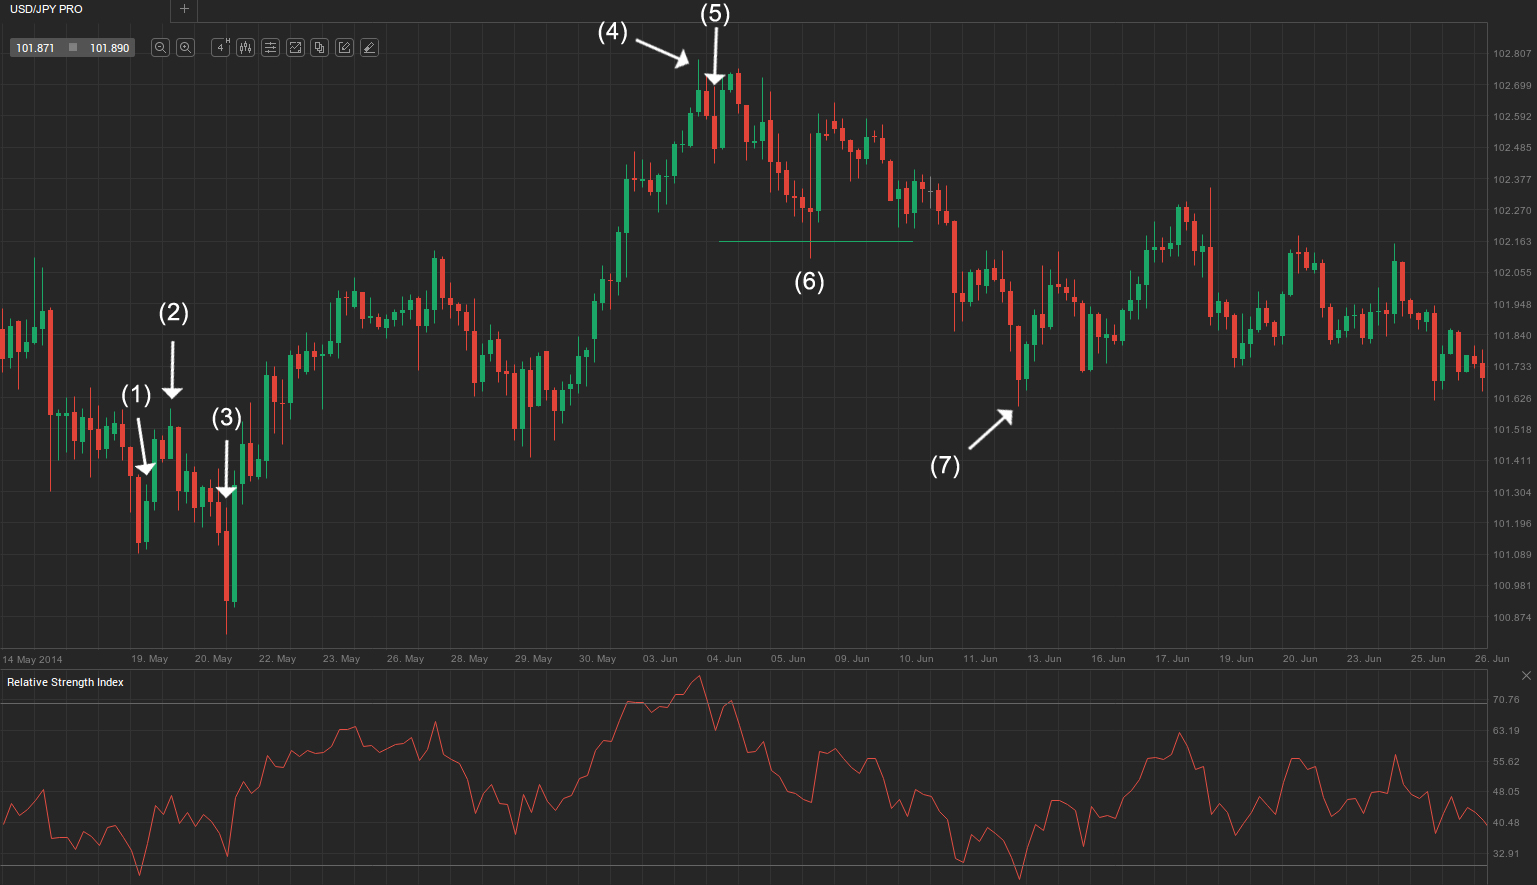
In the screenshot above you can see a four-hour timeframe of the USD/JPY cross. At that point the market had been trading sideways for more than a month, which means the first condition for using this strategy had been met. The bullish trend bar (1) was accompanied by the RSI rising above 30, which called for a long entry at the open of the next bar, so we entered at 101.27 yen. Our stop-loss was placed several pips below the most recent swing low, which was at 100.75 (not shown in the screenshot), so we set it at 100.68 and risked 59 pips.
According to our strategy, the first half of the trade should be closed at 50% of the amount risked, or 59/2 = 30 pips, which is at 101.57 yen. This target was reached almost immediately at bar (2), so we moved our stop-loss to breakeven. Our trade was now secured and the worst-case scenario became the stop on the remainder of the position being hit, which would leave us with our initial gain of 30 pips.
Unfortunately, that is exactly what happened. The market fell to a lower low shortly after, at bar (3), and our breakeven stop was hit. Because the RSI did not enter the oversold area again, it did not trigger a new entry signal, and we missed out on the subsequent strong up-move that took the market to a swing high at bar (4).
However, the new swing high offered us a short entry. At bearish trend bar (5) the RSI fell below 70, generating a short signal. We sold at the open of the next bar (at 102.48 yen) and placed our stop-loss 5-10 pips above the most recent swing high, which was at 103.01 yen (not displayed on the screenshot), so we set it at 103.10 yen. Our first profit target was then placed at 50% of the amount risked, or 102.48 – ((103.10 – 102.48)/2) = 102.17 yen. It is marked by the green horizontal line and was reached at bar (6). As we exited half of the position, we trailed our stop to breakeven. The subsequent pullback failed to trigger our stop and we capitalised on the following down-move. We exited at bar (7), where the RSI entered the oversold area, with a considerable profit, and immediately re-entered a long position after the indicator left the oversold zone.