Picking highs and lows on inside days using Bollinger Bands
You will learn about the following concepts
- General thoughts on trend trading
- Bollinger Bands
- Determining reversals following swing highs or lows
- Trade rules and examples
We have emphasised many times that novice traders should practise trend trading and avoid going against the market at all costs. However, although following the trend is the safest way to profit from the financial markets, many beginners still struggle with it. The logic behind ‘buy low – sell high’ or ‘buy high and sell higher’ is sound and straightforward, but it requires determining whether a market top is the trend’s last high or will be followed by a higher high. Making the correct prediction will mean the difference between going long and riding the trend up, going short and catching the reversal, or doing exactly the opposite and being wrong.
This article presents a trading strategy that aims to pinpoint swing highs and lows with a high probability of being followed by a reversal. It is based on Bollinger Bands, but not exclusively. Although prices that touch, undershoot or overshoot the Bollinger Bands are considered high or low, you can’t rely solely on these indications because exceedingly strong trends can ride these boundaries for a prolonged period. Thus, we need additional confirmation to determine whether the move’s strength has been exhausted or will continue.
- Trade Forex
- Trade Crypto
- Trade Stocks
- Regulation: NFA
- Leverage: Day Margin
- Min Deposit: $100
As such, we will incorporate a filter that signals market exhaustion and a potential counter-trend move. We will enter the market after the price has touched one of the BB boundaries only if the following bar does not hit a new high or low, and is therefore an inside bar. This pattern signifies a period of contracted volatility, indicating that the previous move’s strength is waning and the chance of a reversal is much higher. The combination of Bollinger Bands and inside bars therefore helps you enter reversals by selling excessively high or buying excessively low prices. Let’s continue with the specifics.
Trade rules
 This strategy is most commonly used on a daily time frame, but any time frame higher than the hourly chart will also work well. By default, Bollinger Bands use a look-back period of 20, which is what we will use in our example as well.
The first step is to look for a point where the currency pair touches or closely undershoots the lower Bollinger Band. When this occurs, you need to wait and see whether the next bar’s low is higher than, or at least equal to, the low of the bar that interacted with the band. Moreover, its high must also be lower than, or at most equal to, the previous bar’s high. If all these conditions are met, the second bar becomes the signal bar and we enter on the third bar as soon as it breaks the signal bar’s high.
Our initial stop is placed several pips below the low of the second (signal) bar to prevent random noise from triggering it. As the price retraces and reaches the 20-period moving average, we trail our stop to the 20-period SMA after a bar closes on the opposite side of it. The trade is then exited as soon as the price reverses and crosses the SMA from above.
This strategy is fairly simple to incorporate into your trading plan, which is one of its main advantages. You can easily measure your risk exposure and use it on different time frames, making it suitable for many types of traders. However, bear in mind that the shorter the time frame, the higher the probability of a false entry signal, as the smaller chart encompasses less data and therefore does not fully reflect crowd behaviour.
Also, don’t forget that you can adjust some of the strategy’s parameters, especially regarding trade management. For example, instead of waiting for the price to reach the SMA to trail your stop, you can exit half of your position as soon as you achieve a profit equal to 50% or 100% of the amount risked and then trail your stop to break-even. After that, you can manage the remainder of the position according to the rules outlined earlier. This is simply another, more conservative, way to manage your money.
Example
Take a look at the following example.
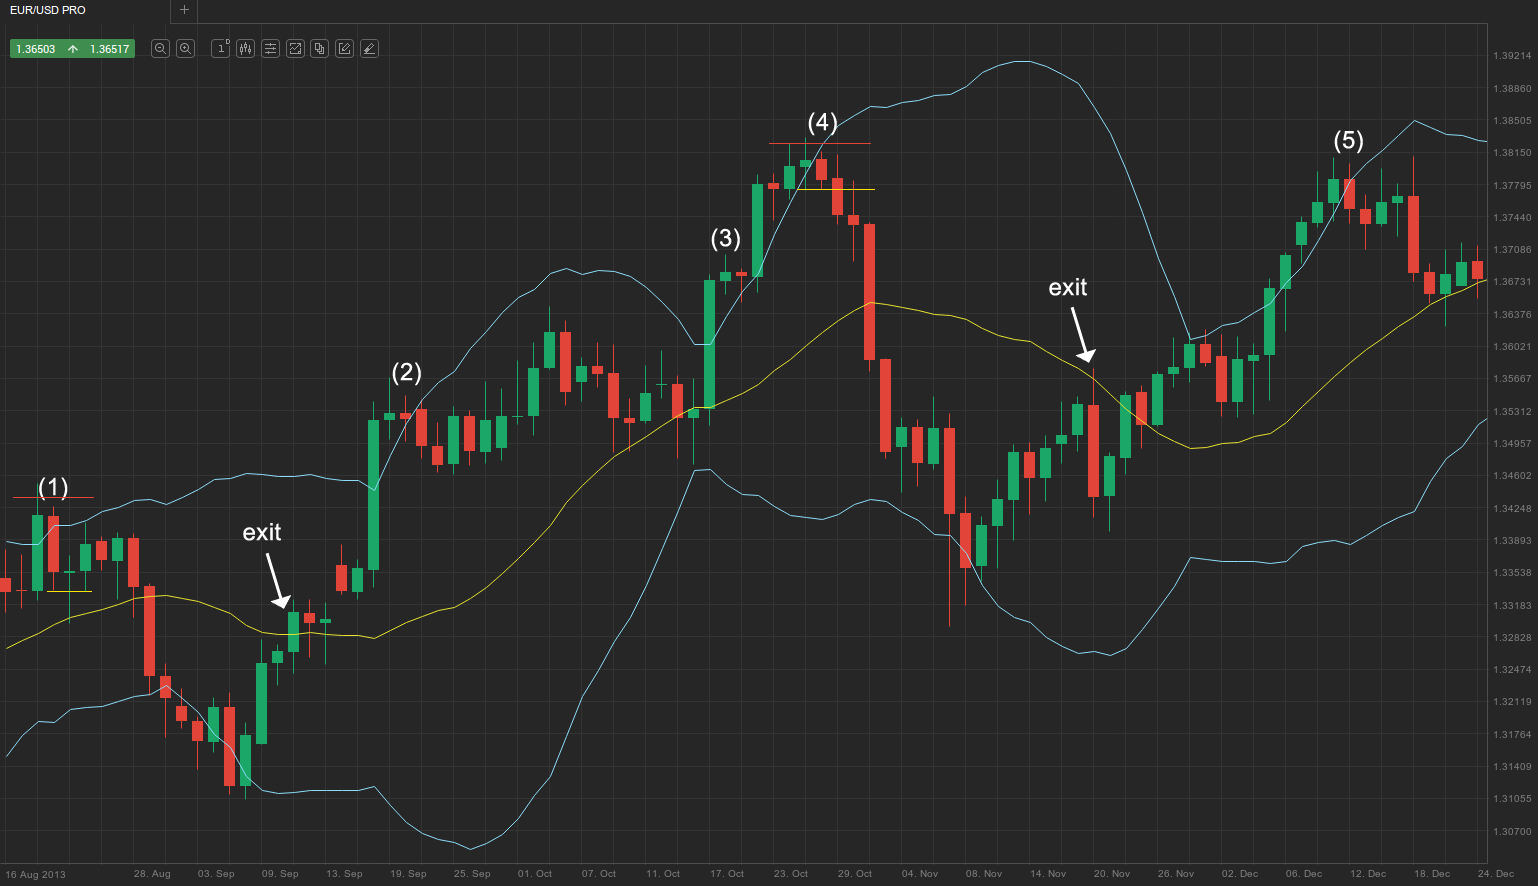
You are looking at the EUR/USD pair on a daily time frame with a 20-period BB. At bar (1) the market formed an inside day within the previous bar, which was the first to penetrate the upper Bollinger Band. We enter the market as the next bar breaks the signal bar (1)‘s low, as marked by the yellow line. The stop-loss is placed several pips above the signal bar’s high, shown by the horizontal red line. When the price reaches the SMA and a bar closes below it, we trail our stop to the SMA. The position is exited once the price reverses and crosses the SMA from below.
Right before bar (2) the market once again penetrated the upper Bollinger Band but did not generate a short entry signal, as bar (2) was not an inside bar relative to the previous one, nor was the next bar relative to bar (2). As you can see, we were right not to enter at that point; it would have been a losing trade.
There was another boundary overshoot right before bar (3), but once again there was no inside bar and we were right not to enter.
However, shortly afterwards we were presented with a suitable entry point. The market had closed above the upper Bollinger Band for seven consecutive bars, and bar (4) was the first to form within the Bollinger Bands channel. Moreover, it was an inside bar, so applying our strategy here was reasonable. We enter the market as soon as the next bar penetrates bar (4)‘s low, as marked by the horizontal yellow line, while our protective stop is placed several pips above bar (4)‘s high. As with the previous trade, we trail our stop on a closing basis with the SMA as soon as the price reaches it, and the position is closed later when the SMA is crossed from below.
Later, shortly before bar (5), the upper Bollinger Band was once again overshot, but bar (5)‘s low exceeded the preceding one’s low, failing to generate a short entry. This was another good call; had we taken the trade, our initial stop would have been hit. See below how the market movement developed.
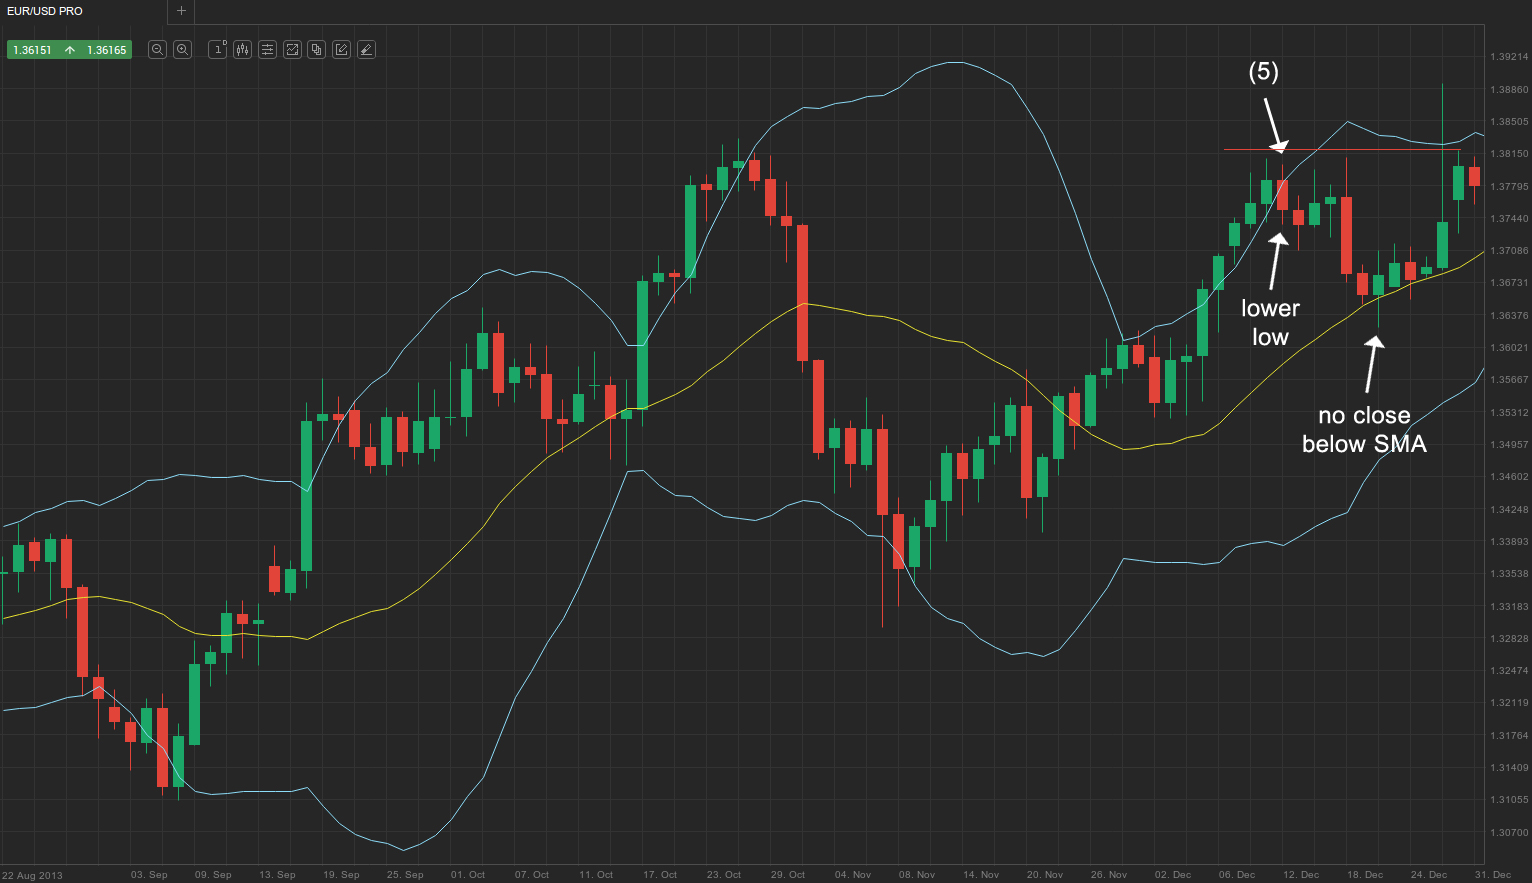
As you can see, even if we had entered below the low of bar (5), there wouldn’t have been a single bar to close below the SMA; therefore, we couldn’t have trailed our stop. Several bars later, a rally that penetrated the upper band would have taken out our initial stop, rendering the trade a loser.