Forex trading strategy – the Bladerunner
You will learn about the following concepts
- Indicators used with this strategy
- Signals to look for
- Entry point
- Stop-loss
- Profit target
 The only technical indicator we use for this strategy is the 20-period Exponential Moving Average (EMA). The strategy is suitable for any time frame and any currency pair. In the examples below, we use the 5-minute chart of USD/SEK. The strategy is named ‘Bladerunner’ because the 20-period EMA ‘cuts’ the price in two like a blade. If the price is above the EMA and retests it, the market is likely to continue upwards. Conversely, if the price is below the EMA and retests it, the market is likely to continue downwards.
If the price is above the EMA, a trader’s bias will be long, so they will probably look for the price to drop, hit the EMA, bounce from it and then move upwards. However, if the price moves through the EMA and closes well below it, the trader may assume that polarity has changed, and the bias switches to short.
- Trade Forex
- Trade Crypto
- Trade Stocks
- Regulation: NFA
- Leverage: Day Margin
- Min Deposit: $100
If the price is below the EMA, a trader’s bias will be short, so they will probably look for the price to rise, hit the EMA, bounce from it and then move downwards. However, if the price moves through the EMA and closes well above it, the trader may assume that polarity has changed and the bias switches to long.
 In order to enter the market, a trader must take two key factors into account:
First, the price must break out of a trading range before the entry, or already be trending;
Second, the price must then retest the EMA successfully. What does that mean? If the price is currently below the EMA, it must bounce from it and remain below it, and vice versa. In addition, the first candle that comes into contact with the EMA must close on the same side of the moving average from which it approached. Once this occurs, the trader regards this candle as the signal candle. Next, they wait to see whether the following candle confirms the move. If the next candle indeed continues to move away from the EMA, it provides confirmation. Some traders, however, may require additional evidence before taking the trade (for instance, a well-known candlestick formation).
Furthermore, a trader may feel more confident entering a position when they have more than one reason to trade – for example, not only a bounce from the EMA but also confluence with a prior support or resistance level, or a pivot point.
When going long:
First, the trader may place two stop orders to buy, with the entries 2-3 pips above the candle that provides confirmation;
Second, the protective stop may be placed 2-3 pips below the signal candle that came into contact with the EMA;
Third, the profit target on the first stop order should be set at a distance equal to the risk, measured in pips. If the risk for this position is 25 pips, the profit target for the first order should also be 25 pips;
Fourth, the profit target on the second stop order should be set at a distance equal to double the risk in pips. If the risk is 25 pips, the profit target for the second order should be 50 pips.
When going short:
First, the trader may place two stop orders to sell, with the entries 2-3 pips below the candle that provides confirmation;
Second, the protective stop may be placed 2-3 pips above the signal candle that came into contact with the EMA;
Third, the profit target on the first stop order should be set at a distance equal to the risk, measured in pips. If the risk for this position is 25 pips, the profit target for the first order should also be 25 pips;
Fourth, the profit target on the second stop order should be set at a distance equal to double the risk in pips. If the risk is 25 pips, the profit target for the second order should be 50 pips.
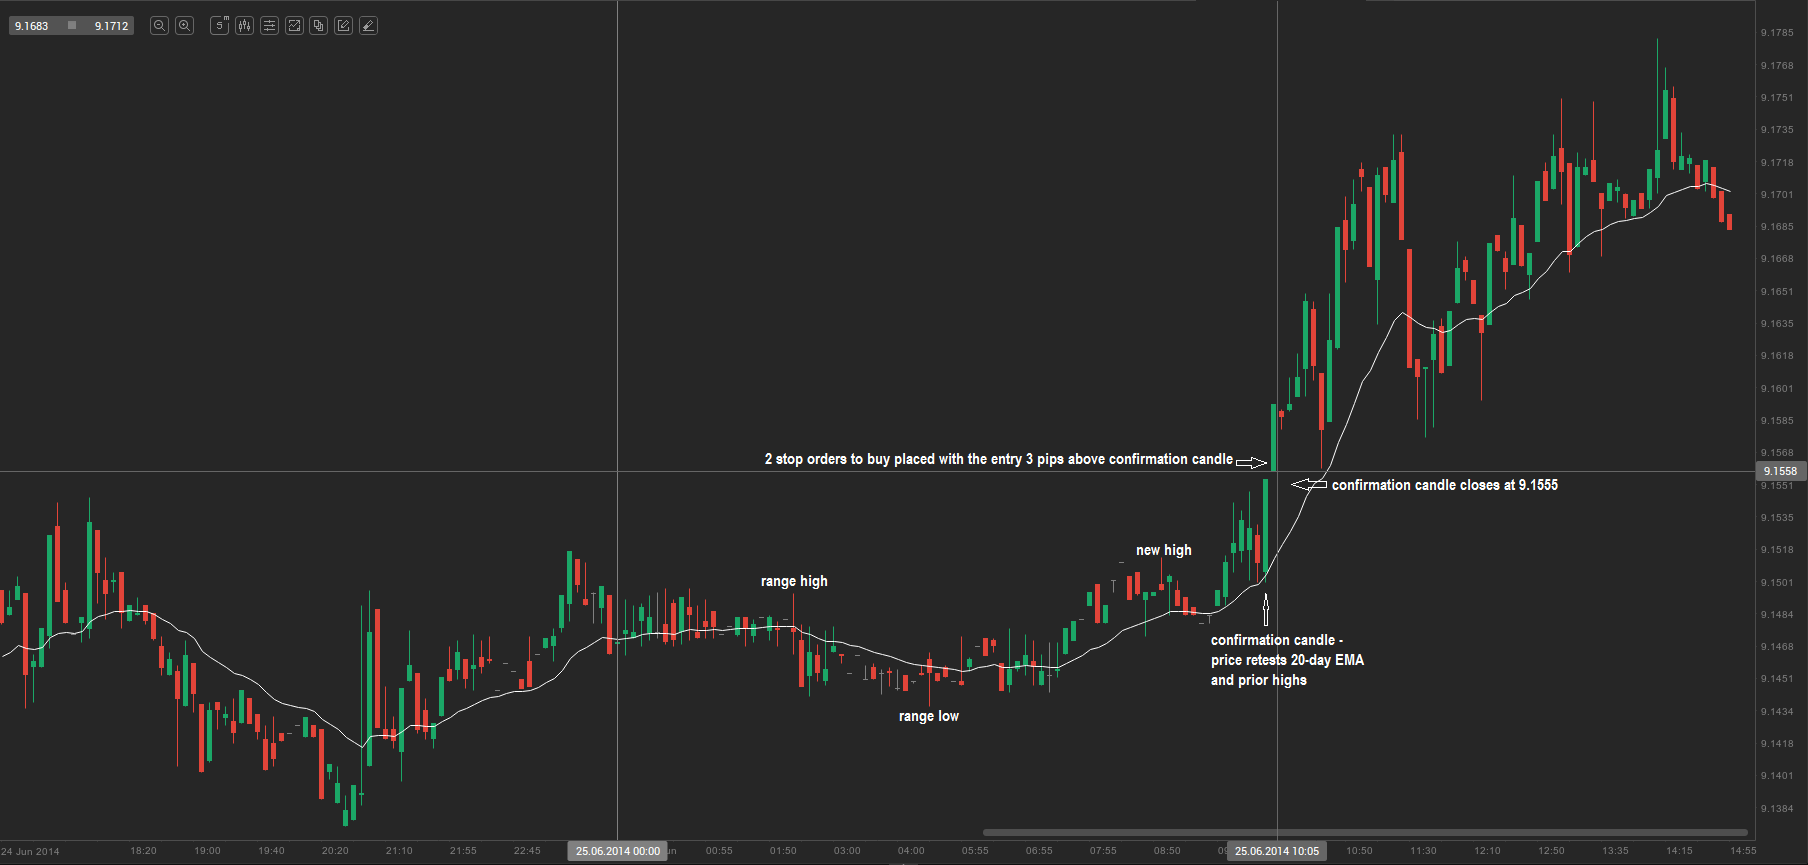
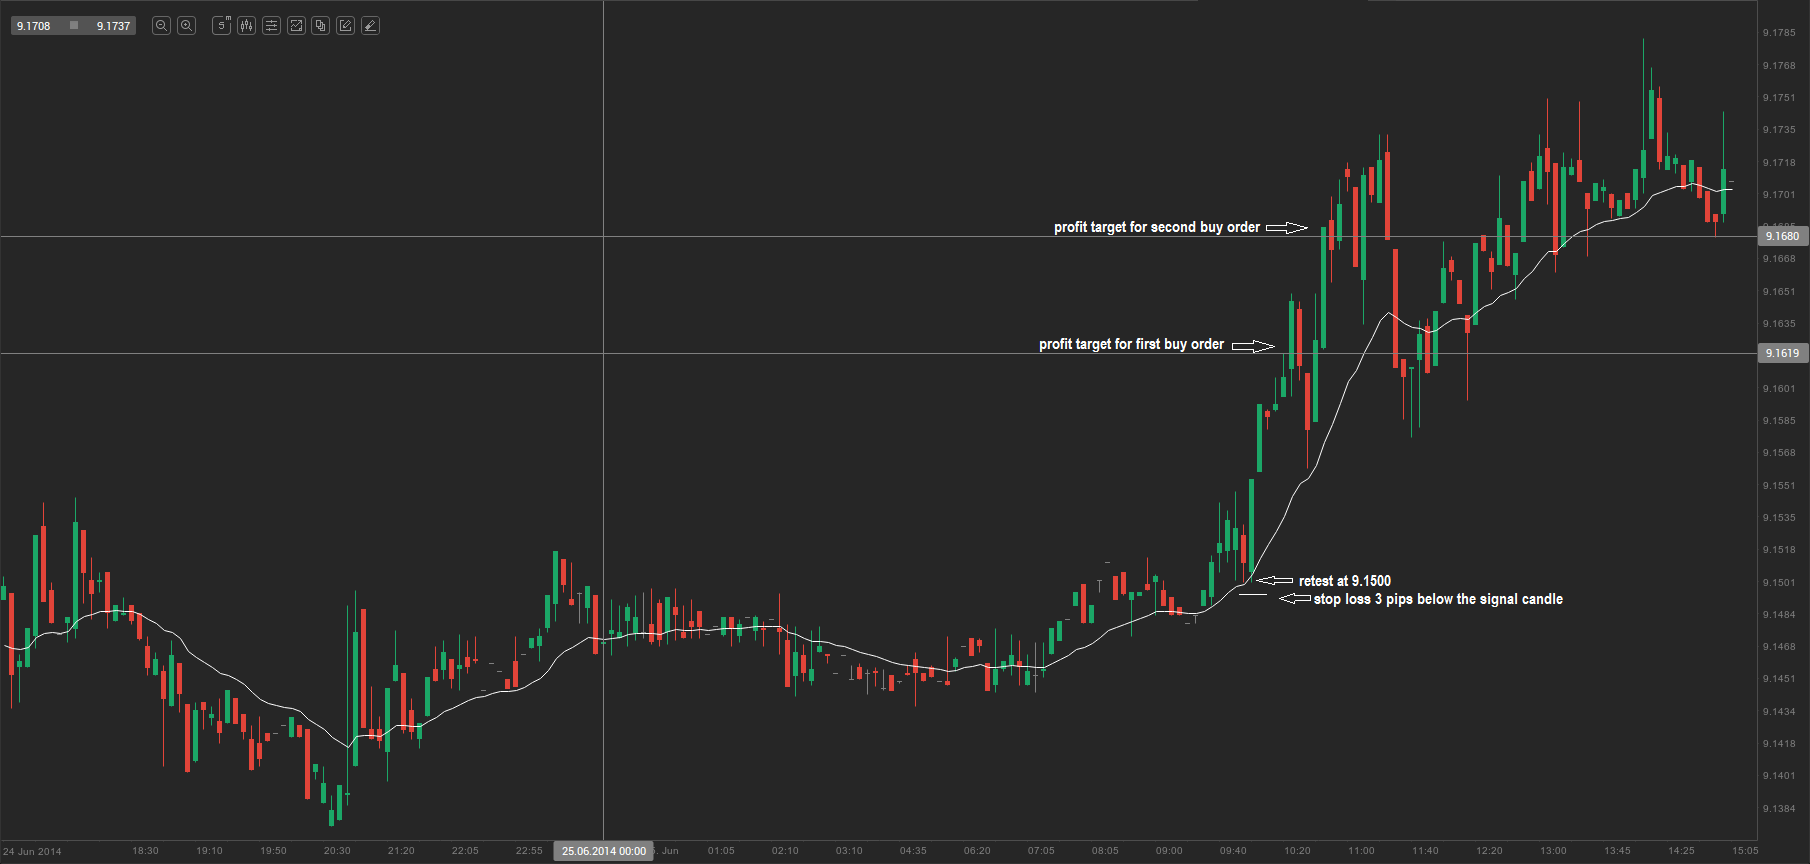
Let us take a look at the 5-minute chart of USD/SEK below. At the start of the trading day on 25 June we began looking for the range high and range low. Eventually, the price broke out of the range and reached a new higher high. Next, we anticipated a successful retest of both the 20-period EMA and the prior range high. This occurred at 9.1500 (the medium-sized bearish candle on the chart, which we regard as the signal candle because it closed on the same side from which it approached the moving average). The following bullish candle confirmed the move to the upside and thus became the confirmation candle. It closed at 9.1555. We then placed two stop orders to buy, with the entry point 3 pips above the close of the confirmation candle, at 9.1558. The protective stop was placed 3 pips below the signal candle, at 9.1497. The entry at 9.1558 and the protective stop at 9.1497 created a risk of 61 pips. The profit target on our first buy order was equal to the number of pips risked (61 pips), so we took profit at 9.1619. The profit target on our second buy order was twice the number of pips risked (122 pips); therefore, we closed our second position at 9.1680. The total profit on this trade was 61 pips + 122 pips, or 183 pips.