Forex trading strategy – combining exponential and weighted moving averages
You will learn about the following concepts
- Indicators used in this strategy
- Signals to look for
- Entry point
- Stop-loss
- Profit target
In this strategy, we examine the 1-hour chart of USD/CAD. The indicators we use are an 18-period Exponential Moving Average (EMA) (white on the chart below), a 28-period EMA (also white), a 5-period Weighted Moving Average (WMA) (yellow), a 12-period WMA (blue), and the Relative Strength Index (RSI) with a period of 21, an oversold level of 30, and an overbought level of 70.
The two exponential moving averages form a tight zone and indicate the beginning and end of a longer-term trend. The two weighted moving averages show where a trader can enter and exit the market in the shorter term and also reveal the strength of the trend.
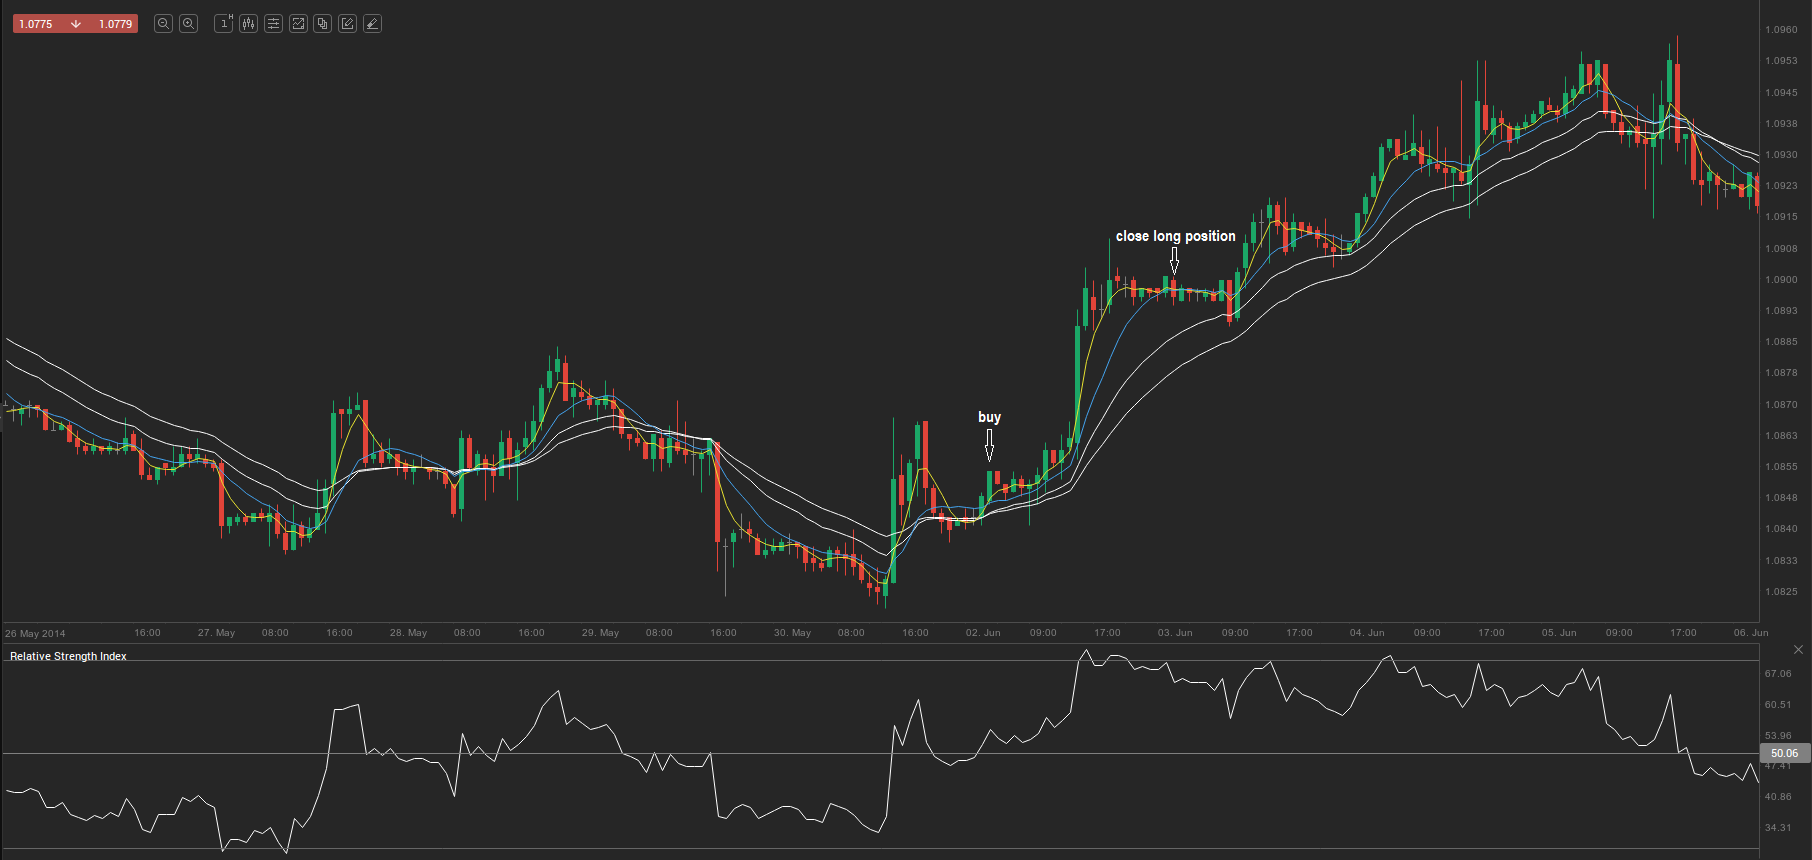
A trader usually looks for a long entry only when the area between the two EMAs is very tight or has been crossed. In addition, the 5-period and 12-period WMAs must cross this area from below to above. If the 5-period WMA also crosses the 12-period WMA from below to above, the signal is further strengthened. The RSI must be above 50.00. The trader closes the position after the market peaks and the 5-period WMA crosses the 12-period WMA from above to below.
- Trade Forex
- Trade Crypto
- Trade Stocks
- Regulation: NFA
- Leverage: Day Margin
- Min Deposit: $100
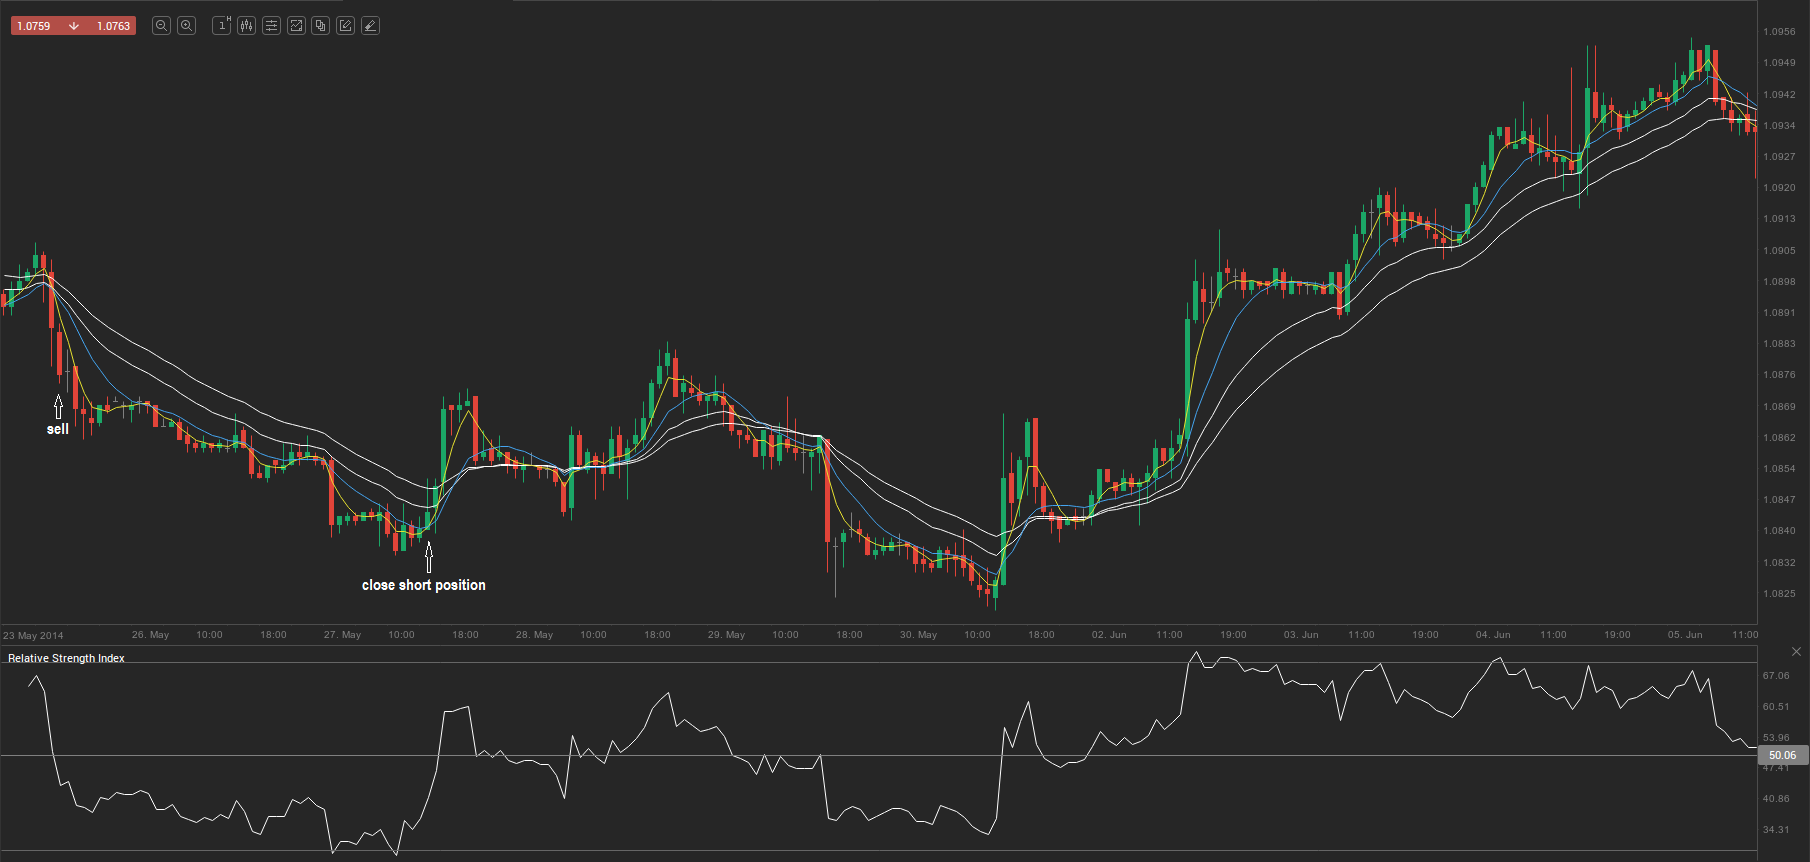
A trader usually looks for a short entry only when the area between the two EMAs is very tight or has been crossed. In addition, the 5-period and 12-period WMAs must cross the area from above to below. If the 5-period WMA also crosses the 12-period WMA from above to below, the signal is further strengthened. The RSI must be below 50.00. The trader closes the position after the market has fallen to a bottom and the 5-period WMA crosses the 12-period WMA from below to above.
Below are two examples of this strategy: a short entry and a long entry.