Forex trading strategy – combining multiple EMAs with the RSI
You will learn about the following concepts
- Indicators used with this strategy
- Signals to look for
- Entry point
- Stop-loss
- Profit target
Previously in our trading strategies guide, we explained several combinations of different indicators, but their number did not exceed two or three. In this article, we present a trading system based on five different Exponential Moving Averages combined with the Relative Strength Index.
This trading strategy can be used with any currency pair and on almost any time frame, but a longer time frame is preferred – 30 minutes or higher. Although it will provide counter-trend signals, we will refrain from commenting on or visualising them for now, because novice traders should not trade against the market at all. If you are not a beginner, you will easily identify the counter-trend entry points yourself.
As we said, we will use five different Exponential Moving Averages. Firstly, we need an 80-period EMA to show us the major trend’s direction – if the price is above the 80-period EMA, we have a bull trend and vice versa.
Secondly, we will use 21-period and 13-period EMAs to identify the current trend’s direction (the minor trend within the major trend). If the EMA with the shorter look-back period (in this case the 13-period EMA) is above the one with the longer look-back period (the 21-period EMA), we have a bullish minor trend, and vice versa.
- Trade Forex
- Trade Crypto
- Trade Stocks
- Regulation: NFA
- Leverage: Day Margin
- Min Deposit: $100
Thirdly, we use two additional EMAs with even shorter look-back periods, in conjunction with the Relative Strength Index, to generate entry signals. Specifically, they are a 3-period EMA and a 5-period EMA; their crossover, when confirmed by the appropriate RSI value, tells us whether to enter long or short. However, more conservative trading (which we advise novice traders to practise) calls for ignoring entry signals that are opposite to the 80-period EMA, and therefore against the major trend.
Therefore, a long, with-trend entry signal is generated when the 3-period EMA crosses the 5-period EMA from below and rises, with both of them penetrating the channel formed by the 13-period and 21-period EMAs. Moreover, the 80-period EMA must be below the price action (indicating a bull trend) and the RSI must be above 50. The entry should be executed after the signal bar closes beyond the 5-period EMA.
Conversely, a short, with-trend entry signal is generated when the 3-period EMA penetrates the 5-period EMA from above and continues lower, with both of them crossing the channel formed by the 13- and 21-period EMAs. This move must also be accompanied by an RSI reading below 50, and the 80-period EMA must be above the price action.
There are several exit rules. You should lock in gains as soon as the 13- and 21-period EMAs cross again and signal a reversal in the current trend, or if the 3- and 5-period EMAs cross back through the channel formed by the 13- and 21-period EMAs. Additionally, exit if the RSI crosses back through the 50 level or hits the overbought or oversold thresholds (in our case 75 and 25), which indicates a much higher likelihood of an impending reversal. A cross of the 80-period EMA also requires an immediate exit. See the following example.
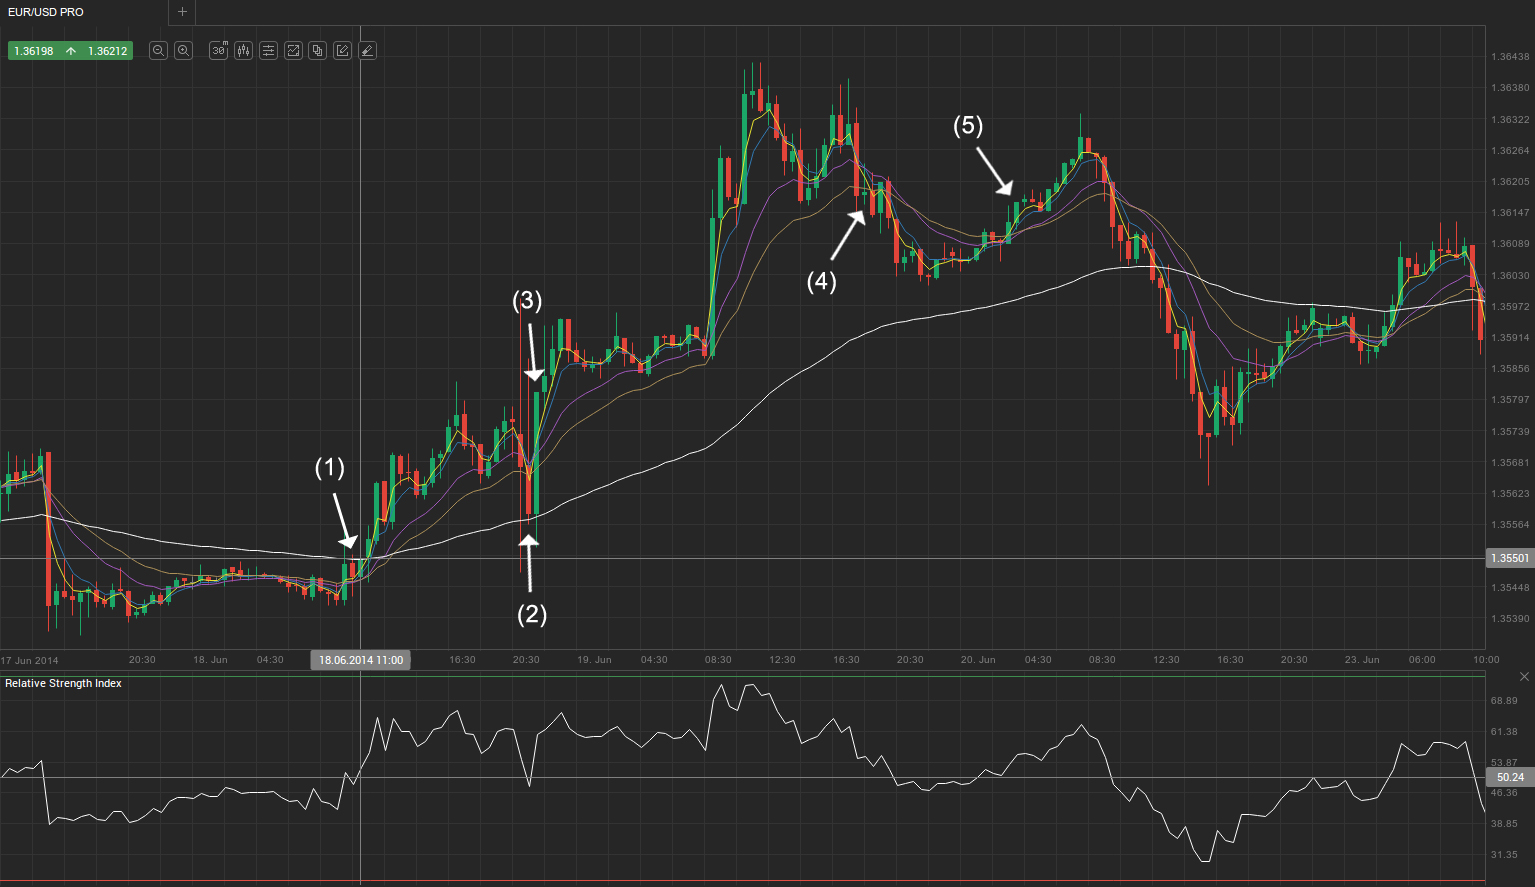
The yellow line illustrates the 3-period EMA, while the 5-period EMA is in blue. The 13- and 21-period EMAs are in purple and brown respectively, while the 80-period EMA is coloured white.
As you can see, the market was in a trading range at the beginning of the chart, as evidenced by the flat 80-period EMA. Acceleration then followed, and the price and all the shorter EMAs crossed the 80-period EMA from below at (1), generating a buy signal. At the entry bar the RSI was above 50 and both the 3- and 5-period EMAs had crossed the 13-21 EMA channel. The green line represents our entry level.
At (2) the market staged a pullback and the 3-period EMA penetrated the channel, while the RSI fell below 50, both signalling an exit from the position. However, because the bull trend continued and both the 3- and 5-period EMAs once again crossed above the channel, we entered long on the close of bar (3). After the ensuing strong upward move, we could either scale out and trail the stop behind the remaining portion, or hold the entire position until an exit signal appeared. Such a signal was generated at bar (4) when the short-look-back EMAs crossed below the medium-term ones.
There was only one other with-trend signal that met the conditions of our strategy – at bar (5) – which, however, was not followed by a sufficiently strong move and resulted in a minor loss.