Combining RSI, full stochastic oscillator and SMA
You will learn about the following concepts
- Relative Strength Index
- Full Stochastic Oscillator
- SMA
- Combining the three
This article will introduce you to another useful and reliable trading system based on a combination of a slow Simple Moving Average, the Full Stochastic Oscillator and the Relative Strength Index.
It uses tight stop-loss protection while aiming for high potential profits by producing accurate entry signals. It is best practised on a daily time frame to limit the effects of whipsaws and can be used with any currency cross.
It consists of three indicators – a 150-period Simple Moving Average, a 3-period Relative Strength Index with overbought and oversold levels at 70-80 and 30-20, respectively, and a Full Stochastic Oscillator with 6, 3, 3 settings and the same overbought/oversold areas.
The first condition that must be met to initiate a long entry is for the 150 SMA to be below the price action, thus signifying a bull trend. Once the Relative Strength Index drops into the oversold area, look for a bullish crossover of the Stochastic lines while they are also within their oversold zone (basically, you need a bull trend with both indicators showing that the market is oversold, with the Stochastic displaying a bullish reversal).
- Trade Forex
- Trade Crypto
- Trade Stocks
- Regulation: NFA
- Leverage: Day Margin
- Min Deposit: $100
Conversely, a short-entry signal is generated when the 150 SMA is above the price action, signifying a bear trend, and both the RSI and the Stochastic are in the overbought area. As soon as the Stochastic’s fast and slow lines make a bearish crossover, you must enter short on the next price bar.
Stop-loss and profit target
 We have said that this strategy offers a high degree of capital protection because it places stop-loss levels at the most recent swing low. As for the profit target, as usual you can either use a fixed target and exit your entire position, or scale out upon reaching it and leave a portion in the market while protecting it with a trailing stop.
An exit signal is generated when the Stochastic reaches the opposite overbought/oversold level (overbought for a long position and vice versa). At that point you can either exit the entire trade, scale out and use a trailing stop, or keep the entire position and trail your stop. The trailing stop is typically placed below the low of the previous bar in a bull trend, or above the high of the previous bar in a bear trend. See the following screenshot.
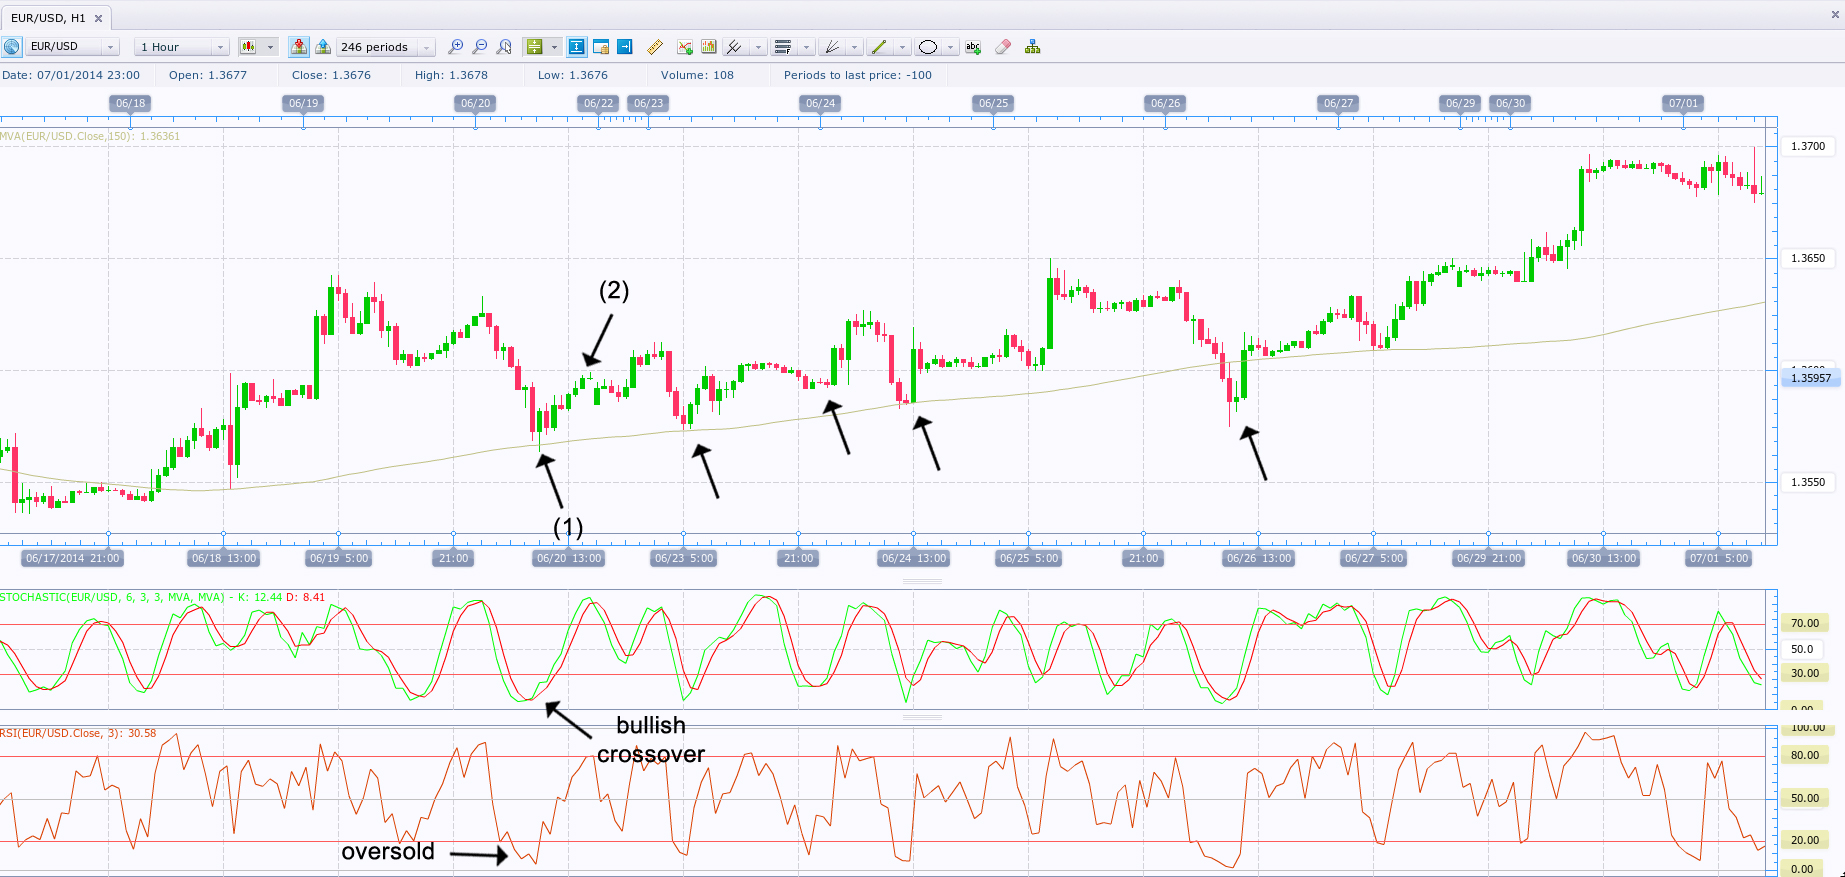
We have used an hourly chart for the example above to show that it too can generate reliable signals, although whipsaws will be much more frequent compared with the daily time frame. As you can see, a strong and protracted bull trend was in motion, as indicated by the rising 150-period SMA. At bar (1) the RSI was deep in the oversold area, while the Full Stochastic performed a bullish crossover, generating a long entry signal. Thus, we will enter above the high of bar 1, at $1.3583.
Our stop-loss is placed several pips (5-10) below the previous swing low (at 1.3547), so we choose 1.3540. We remain in the market until the Stochastic enters the opposite extreme area (in our case, it becomes overbought). At bar (2) the market became overbought and we exited our position at its close, at 1.3596, realising a profit of 13 pips. However, because this results in too small a risk-reward ratio, we might use a different management strategy to achieve better results.
We can instead stay in the market as the Stochastic becomes overbought and immediately trail our stop to break-even. As soon as we reach a 1:1 risk-reward ratio, we can scale out half of our position and leave the remainder in the market to capitalise on a possible extension of the up-move. For the second part of the trade you can trail your stop below the previous bar’s low and move it up as each new bull-trend bar forms.
The market later generated several other possible long-entry opportunities and each one of them could have at least earned a scalper’s profit while running very tight stops and keeping risk low. Thus, this strategy makes for a reliable trend-trading system that fairly accurately pinpoints pullbacks in strong trends, and more importantly – their troughs, which, as we know, are the best with-trend entry points.