Combining Relative Strength Index, Bollinger Bands and EMAs
This lesson will cover the following
- Relative Strength Index
- Bollinger Bands and EMAs
- Combining the three tools
This article presents a trading strategy that combines EMAs, Bollinger Bands and the Relative Strength Index (RSI). It uses a 5-period EMA, a 75-period EMA, 20-period Bollinger Bands and a 14-period RSI. The entry rules are as follows:
Enter long when a bar closes above the 75-period EMA and above the Bollinger Bands’ middle line, while the RSI has a value above 50. Conversely, enter short when a bar closes below the 75-period EMA and the Bollinger Bands’ middle line, while the RSI is at or has broken below 50.
Your stop-loss can be set at a fixed level or trailed. There are three support/resistance levels against which you can place it – the 75-period EMA, the signal bar’s low, or the most recent swing low of the 5-period EMA. You can use the line that lies in the middle of the three as the stop-loss level, and you may wish to add a buffer of several pips so that random noise doesn’t trigger it.
Profit target
 Having determined your stop-loss level, and thus your risk exposure, you can proceed to estimate your profit target. In general, traders should aim for a 1:2 risk-to-reward ratio, but there are many variations. You can begin scaling out after achieving a 1:1 ratio and trail your stop for the remainder of the position, or you can aim for double the amount risked (1:2) with your entire position. Your profit target should generally depend on the amount risked – if your stop-loss is too wide, a 1:2 ratio may be difficult to achieve and therefore too risky (inadvisable for novice traders). Stop-loss placement and profit targets should also be determined in accordance with each trader’s preferred money-management system. Most Forex tutors recommend that beginners risk no more than 2% of their trading capital on a single trade.
- Trade Forex
- Trade Crypto
- Trade Stocks
- Regulation: NFA
- Leverage: Day Margin
- Min Deposit: $100
To learn more about money management and trading psychology, visit our Forex Trading Academy’s Money Management and Trading Psychology sections.
Here is an example of the strategy.
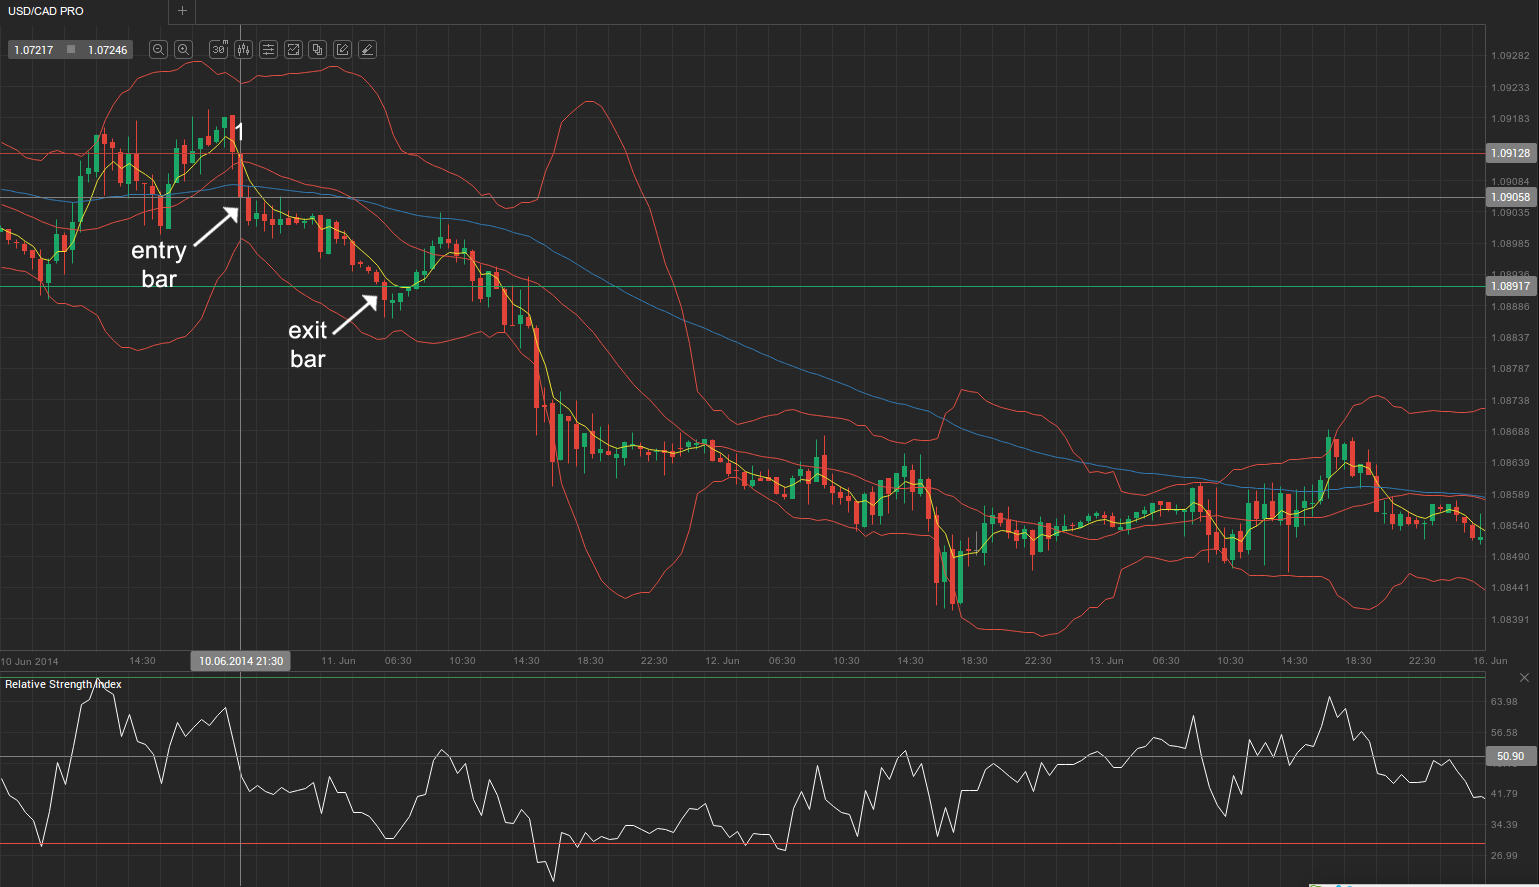
As shown in the example above, we enter at 1.0905, just below the close of bar (1), which has crossed beneath the 75-period EMA (blue line) and the Bollinger Bands’ middle line (red line). The RSI has also just crossed below 50. When considering our stop-loss, we see that the most recent 5-period EMA (yellow line) swing high, the high of the signal bar (1), and the 75-period EMA are close together, with the signal candle’s high lying between the other two. Our stop-loss is therefore set at 1.0912 and is visualised by the red vertical line.
Because our capital exposure is relatively small, we will aim for a 1:2 risk-to-reward ratio, or 14 pips. Our profit target (1.0891) is visualised by the green line. Upon reaching it, a trader might choose to scale out and take partial profit while keeping a portion of the trade in the market to capitalise on a possible trend continuation, or they can exit the entire position.