Key Moments
- WTI trades near $95.20 per barrel during Asian hours on Tuesday, extending a two-day rise.
- The Strait of Hormuz remains mostly closed, which limits Middle East supply and supports prices.
- Ship-tracking data shows six Iranian tankers turned back under a US blockade, while an ADNOC LNG vessel moves toward India after crossing Hormuz.
Supply Constraints Support WTI Rally
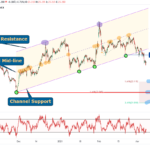
WTI crude oil rises for a second straight session and holds near $95.20 per barrel during Asian trading on Tuesday. This move follows ongoing disruptions in the Strait of Hormuz, a key route for global energy shipments.
Because this vital passage remains largely closed, exports from the Middle East have dropped. As a result, global supply tightens and pushes crude prices higher. At the same time, traders continue to reassess supply risks and watch for further disruptions.
Oil Gains Face Headwinds from Ceasefire Hopes
However, gains may slow as markets weigh the chances of a ceasefire and a possible reopening of shipping routes. Iran recently sent a proposal to the United States through Pakistan, signaling a willingness to stop hostilities under certain conditions.
Specifically, Tehran wants the US to lift its naval blockade, ease transit rules in Hormuz, and guarantee no further military action. Meanwhile, a US official said on Monday that President Donald Trump remains dissatisfied with the proposal. In addition, Iranian sources noted that talks on nuclear issues will not move forward until fighting ends and maritime disputes are resolved.
Ninth Week of Conflict Keeps Energy Markets on Edge
The conflict has now entered its ninth week and continues to disrupt supply chains while lifting energy prices. According to the International Energy Agency (IEA), the market faces a growing risk of supply shocks alongside weaker demand.
At the same time, the standoff shows little progress. Trump’s stance leaves limited room for compromise, while Iran keeps restricting shipments through Hormuz. Since this route handles about 20% of global oil and gas flows, the impact remains significant. Meanwhile, the US continues its blockade of Iranian ports.
Shipping Disruptions and Limited Transit Through Hormuz
Recent ship-tracking data highlights the scale of disruption. For example, six Iranian tankers reversed course after encountering the US blockade, which further limits exports.
In contrast, some movement continues. An LNG tanker operated by ADNOC successfully crossed the Strait of Hormuz and is now approaching India, based on data reported on Monday.
Clarification on Conflict Duration
This report was corrected on April 28 at 02:44 GMT to clarify that the conflict is now in its ninth week, not month.
Market Snapshot: WTI and Hormuz Disruption
| Item | Detail |
|---|---|
| WTI price level | Near $95.20 per barrel during Asian hours on Tuesday |
| Key chokepoint | Strait of Hormuz remains mostly closed |
| Conflict duration | Ninth week |
| Iranian tanker activity | Six tankers turned back due to US blockade |
| Non-Iranian transit | ADNOC LNG tanker crossed Hormuz and is nearing India |
WTI Oil – Key Market Characteristics
WTI is a widely traded type of crude oil. It stands for West Texas Intermediate and ranks among the three main benchmarks, alongside Brent and Dubai Crude. Traders often call it “light” and “sweet” because it has low density and sulfur content.
Producers extract WTI in the United States and distribute it through Cushing, Oklahoma, a major pipeline hub. Because of its quality and accessibility, WTI serves as a key benchmark, and its price appears frequently in financial news.
Core Drivers of WTI Price Action
Supply and demand drive WTI prices. Strong global growth tends to increase demand, while weak growth reduces it. In addition, geopolitical events such as wars, sanctions, or instability can disrupt supply and move prices.
Furthermore, decisions by OPEC play a major role. When the group cuts production, supply tightens and prices rise. On the other hand, higher output usually pushes prices lower. The US Dollar also matters since oil trades in dollars. A weaker dollar often makes oil cheaper for buyers using other currencies.
Role of Inventory Data in Price Discovery
Weekly inventory reports from the American Petroleum Institute (API) and the Energy Information Administration (EIA) also influence prices. These reports show changes in supply and demand.
For instance, falling inventories often signal stronger demand and can lift prices. In contrast, rising inventories may point to excess supply and weigh on prices. The API releases its report every Tuesday, followed by the EIA on Wednesday. Although both reports usually align, markets tend to rely more on EIA data because it comes from a government agency.
OPEC and Its Influence on WTI
OPEC includes 12 major oil-producing countries that set production targets during regular meetings. These decisions often move global oil prices.
When OPEC cuts output, supply tightens and prices rise. Conversely, when it increases production, prices usually fall. The broader OPEC+ group includes additional producers such as Russia, which further strengthens its influence on the market.
 TradingPedia.com is a financial media specialized in providing daily news and education covering Forex, equities and commodities. Our academies for traders cover