Bitcoin prices have rallied nicely through the month of March. However, the digital asset is struggling to maintain this monthly uptrend.
Bitcoin Chart Analysis
The uptrend beginning February 28 in bitcoin fits inside a really nice price trend channel. We can tell bitcoin prices respecting the support and resistance trend lines (blue highlights). Additionally, bitcoin prices have been respecting the mid-line of this channel (orange highlights) suggesting that the market believes this formation is important.
Bitcoin 2 Hour Intraday Chart – March 18
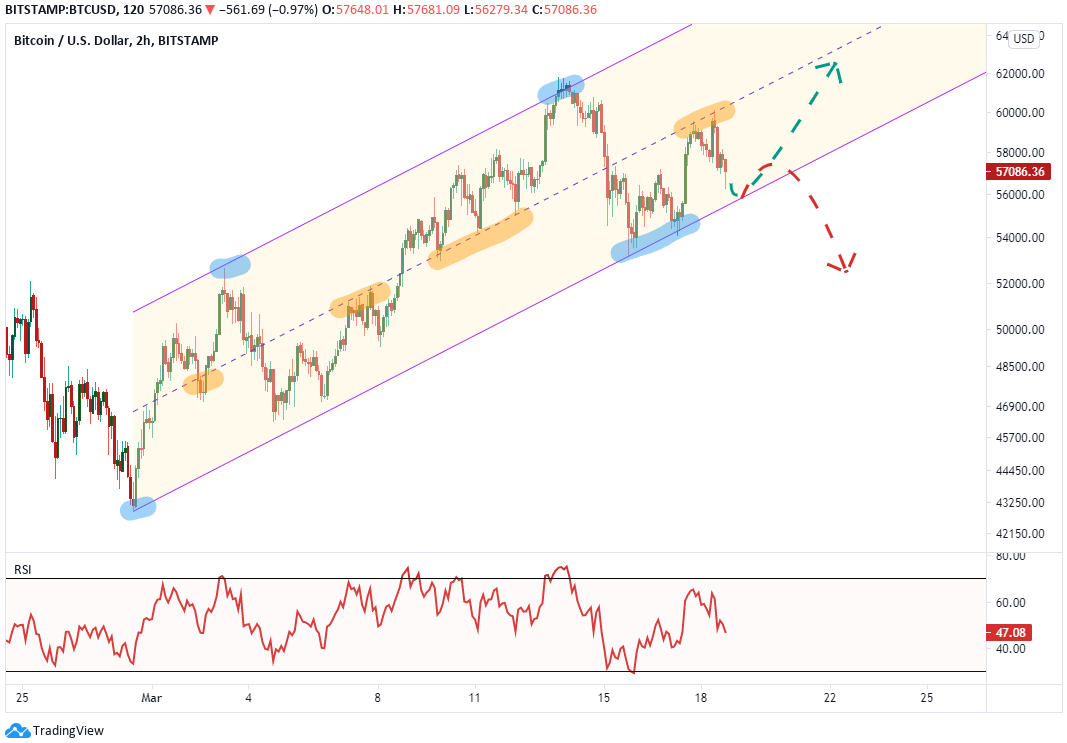
(click chart to enlarge)
The inability of bitcoin prices to rally above the mid-line of this price channel implies a weak market and increases the chances of further losses. In the event prices due correct further, the next level of support appears at the channel support line near $55,600. I suspect bitcoin may react to this level.
However, due to prices hanging out in the lower half of the price channel, I would not be surprised to see bitcoin correct further and break below support.
Bitcoin Price Forecast
The support line of the price channel will likely create a bullish reaction, even if just for a small bump.
If the reaction is medium-term bullish, then bitcoin prices will likely rally back up to the channel mid-line which is in the low 60’s.
If the support trend line fails and breaks, then bitcoin prices will likely correct further down to $49,400.
A Bitcoin Triangle Unfolding?
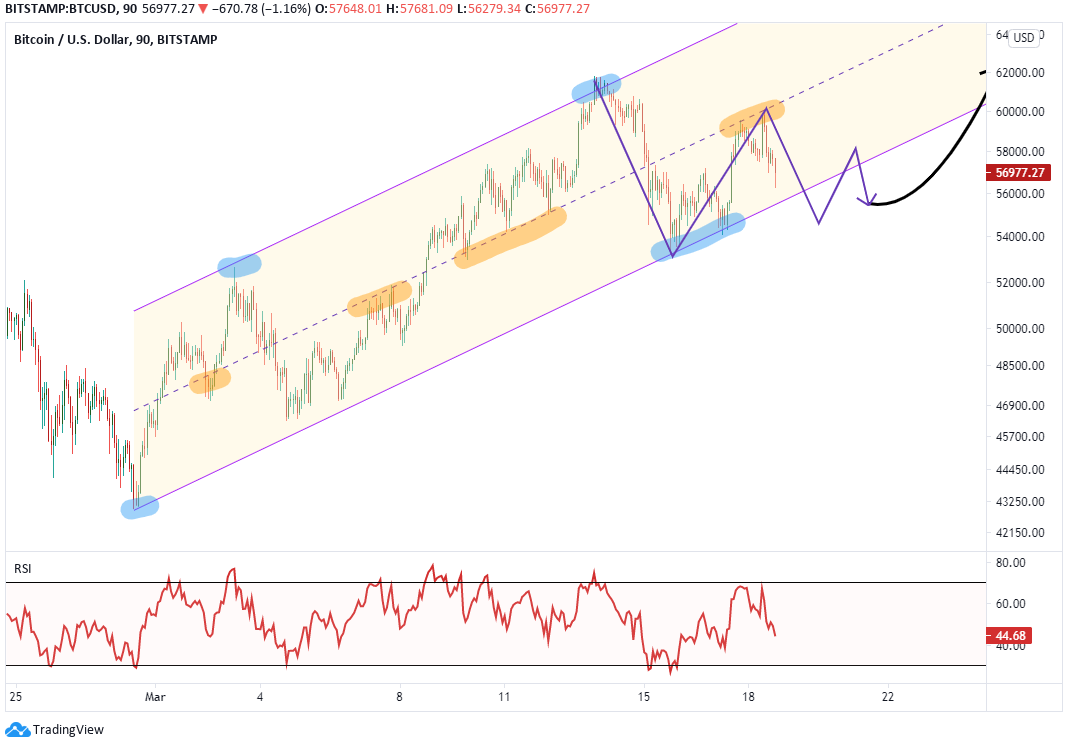
(click chart to enlarge)
There is a third option to which I have my eye on, that is a triangle formation that began March 13. Triangles are typically created with 5 sub-waves and we may be only in the third of those sub-waves. If this triangle scenario unfolds, then we would be looking for a slightly break of the support trend line, but no meaningful correction. That is to say prices continue to grind sideways between $54,000 and $60,000.
Once this sideways consolidation is complete, then bitcoin would likely pop higher above $60,000.
Interested in learning more about how to read charts of bitcoin and other markets? Become a TradingPedia Insider by joining the Trading Price Newsletter and receive clear analysis and education twice per week.