On Monday gold for delivery in June traded within the range of $1,229.40-$1,243.30. Futures closed at $1,230.90, shedding 0.20% on a daily basis. It has been the 27th drop in the past 54 trading days. The daily high has been the highest price level since April 14th, when a high of $1,243.70 was recorded. In weekly terms, gold lost 0.76% of its value during the week ended on April 17th. It has been the 7th drop in the past 15 weeks. The precious metal has risen 0.78% so far during the current month, following three consecutive months of advance.
On the Comex division of the New York Mercantile Exchange, gold futures for delivery in June were gaining 1.04% on Tuesday to trade at $1,243.70 per troy ounce. The precious metal went up as high as $1,247.80 during the early phase of the European trading session, while the current daily low was at $1,229.10 per troy ounce, recorded during early Asian trade.
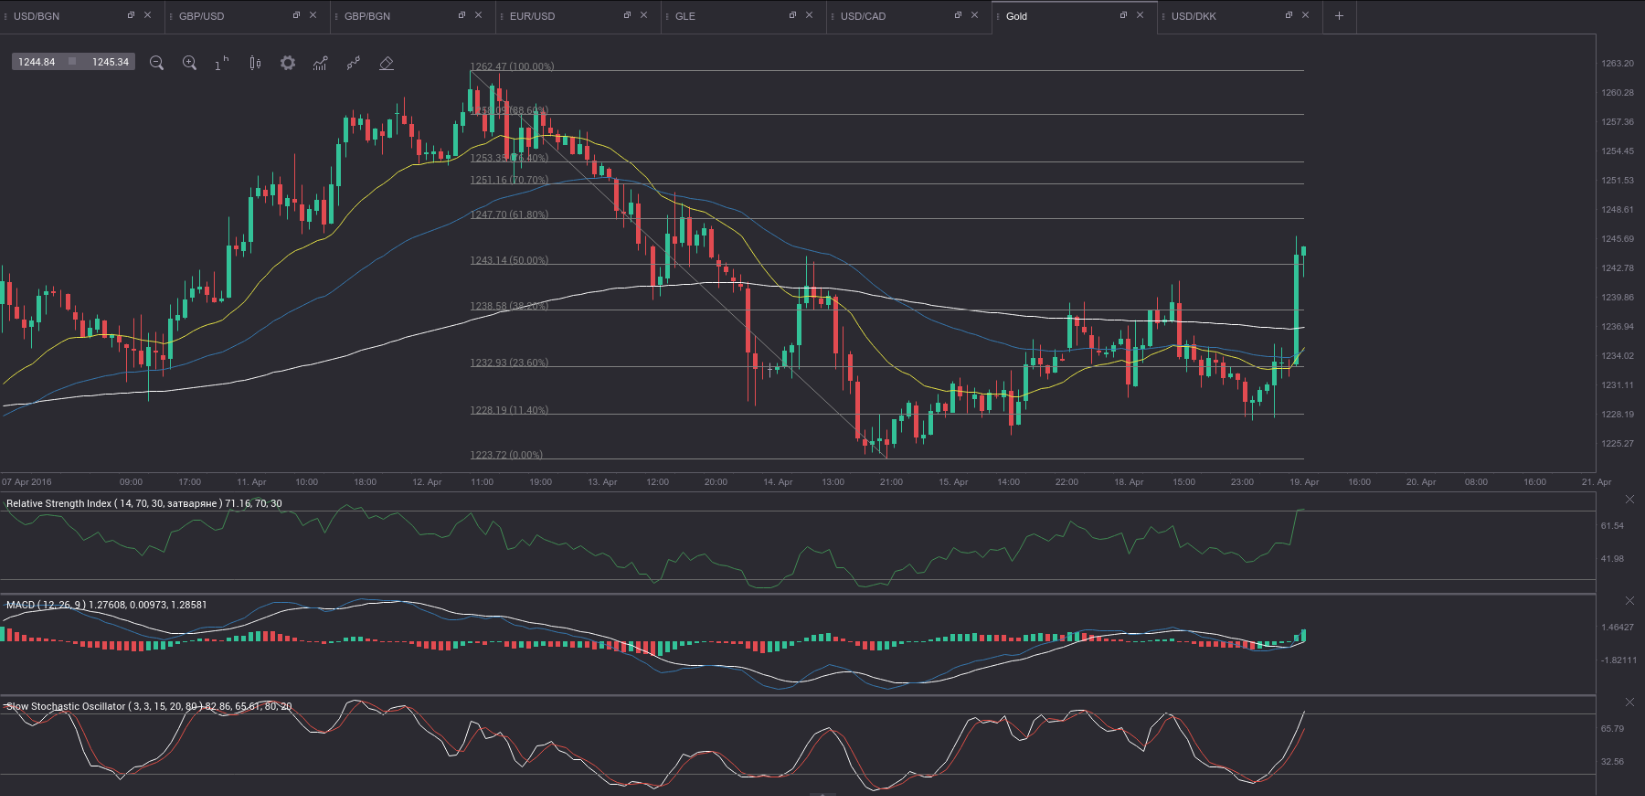
The commodity demonstrated a sharp breakout above the 200-period EMA (white line on the chart) and the 38.2% Fibonacci level, reflecting the descent from April 12th high to April 14th low. The hourly MACD indicates mounting bullish momentum, while the 14-period RSI has just past into overbought territory. In case the bullish move continues, the next resistance may be encountered at $1,247.70 (the 61.8% Fibonacci level) and then – at $1,256.90 (April 13th high). Support may be received at the hourly 200-period EMA ($1,236.85) and then – in the area around the current daily low ($1,229.10).
Meanwhile, silver futures for delivery in May were gaining 2.78% on the day to trade at $16.645 per troy ounce, after going up as high as $16.760 a troy ounce during the early phase of the European trading session. It has been the highest price level since June 2nd 2015, when a high of $16.840 per troy ounce was registered.
Daily and Weekly Pivot Levels
By employing the traditional calculation method, the daily pivot levels for gold are presented as follows:
Central Pivot Point – $1,234.53
R1 – $1,239.67
R2 – $1,248.43
R3 – $1,253.57
S1 – $1,225.77
S2 – $1,220.63
S3 – $1,211.87
By using the traditional method of calculation again, the weekly pivot levels for gold are presented as follows:
Central Pivot Point – $1,239.77
R1 – $1,255.03
R2 – $1,276.97
R3 – $1,292.23
S1 – $1,217.83
S2 – $1,202.57
S3 – $1,180.63