On Monday gold for delivery in December traded within the range of $1,065.70-$1,076.40. Futures closed at $1,066.80, losing 0.89% on a daily basis, while extending the loss from Friday. The daily low has been the lowest level since November 18th, when the yellow metal went down as low as $1,064.00, while the latter has been the lowest price level since February 10th 2010.
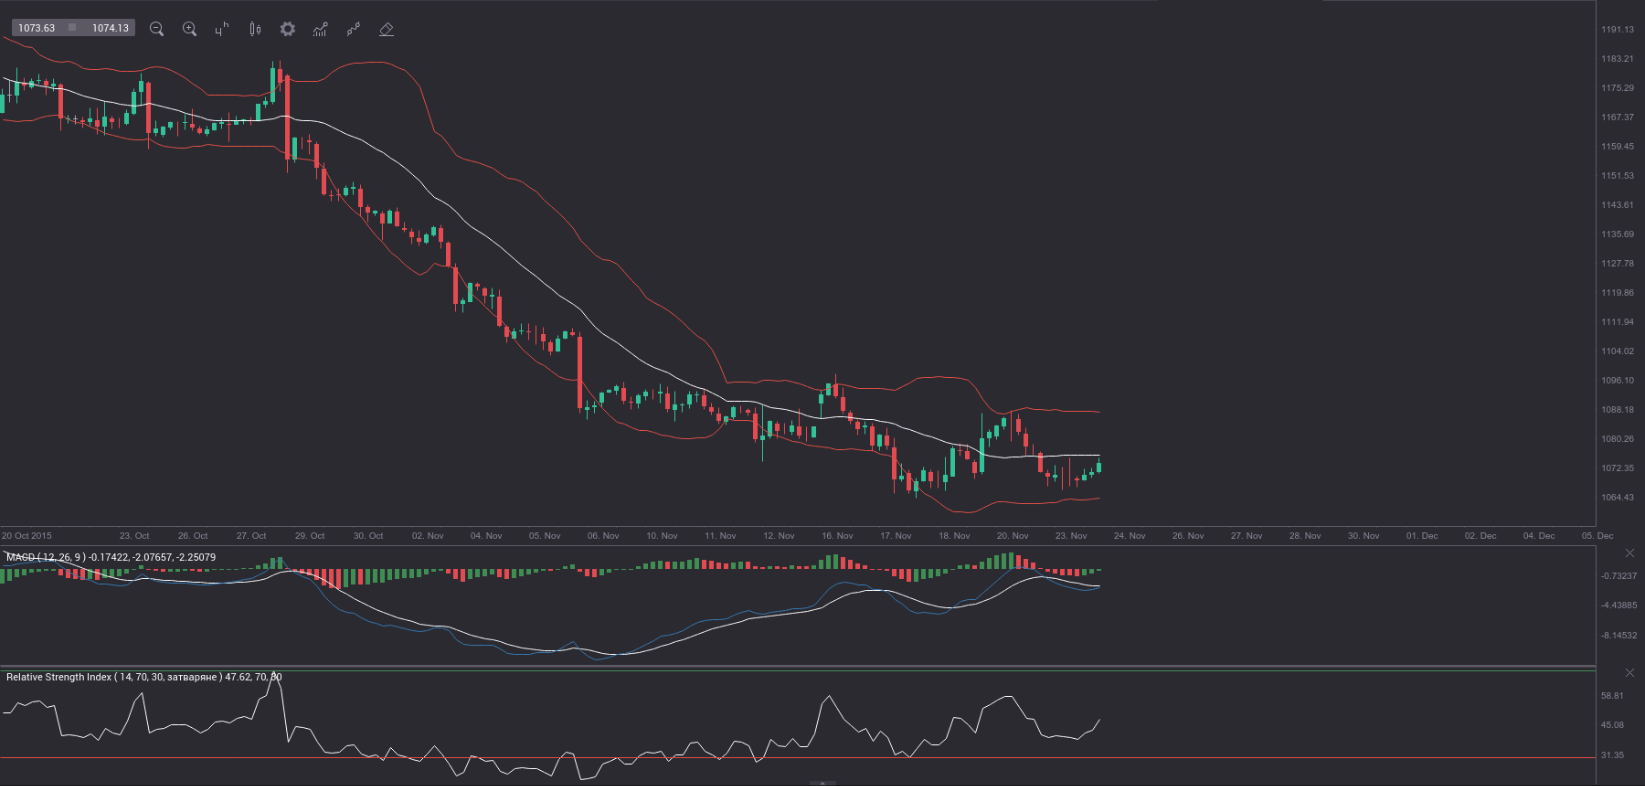
On the Comex division of the New York Mercantile Exchange, gold futures for delivery in December were gaining 0.66% on Tuesday to trade at $1,073.80 per troy ounce. The precious metal went up as high as $1,074.40 earlier today, overcoming the upper range breakout level (R4). Viewed on the 4-hour time frame, the commodity has been trading close to the oversold 14-period RSI zone for a second straight day, while bearish momentum is gradually decreasing. The MACD is set to generate a buy signal, as its main line is about to cross the signal line in a bottom-up manner, while the RSI is set to cross above its 50.00 level. There will probably be a test of the middle Bollinger band and if gold penetrates it and closes consistently above it, a test of November 20th high of $1,087.00 seems probable. If gold fails to move beyond the middle band, it may slide and test the low from November 18th ($1,064.00).
Yesterday gold fell sharply, as the Federal Reserve conducted an unscheduled close-door meeting to discuss the discount rates charged by regional banks.
On Tuesday the commodity may be strongly influenced by another key macroeconomic data set scheduled for release out of the United States. The second estimate of the US Gross Domestic Product probably pointed to an annualized rate of growth of 2.0% in the third quarter of 2015, according to the median forecast by analysts. The preliminary GDP estimate for Q3, reported on October 29th, pointed to an annual growth of 1.5%. In Q2 economy expanded at an annualized rate of 3.9%, according to final data. In case the second GDP estimate outpaced market expectations in Q3, this would have a strong bullish effect on the US dollar and a strong bearish effect on gold, because of the heightened rate hike prospects. The revised GDP report is to be released at 13:30 GMT.
In addition, the Conference Board research group may report that confidence among consumers in the United States improved in November, with the corresponding index coming in at a reading of 99.5, according to market expectations, up from 97.6 in October. The latter has been the lowest index value since July, when the gauge was reported at 90.9. In case the index advanced more than anticipated, this would have a strong bullish effect on the US dollar and would mount selling pressure on gold, as higher confidence suggests a greater willingness to spend and, respectively, an accelerated economic growth. The official index reading is due out at 15:00 GMT.
Daily and Weekly Pivot Levels
By employing the Camarilla calculation method, the daily pivot levels for gold are presented as follows:
R1 – $1,067.78
R2 – $1,068.76
R3 (range resistance) – $1,069.74
R4 (range breakout) – $1,072.69
S1 – $1,065.82
S2 – $1,064.84
S3 (range support) – $1,063.86
S4 (range breakout) – $1,060.92
By using the traditional method of calculation, the weekly pivot levels for gold are presented as follows:
Central Pivot Point – $1,077.60
R1 – $1,091.20
R2 – $1,106.00
R3 – $1,119.60
S1 – $1,062.80
S2 – $1,049.20
S3 – $1,034.40