Yesterday’s trade saw USD/CAD within the range of 1.3229-1.3358. The pair closed at 1.3320, up 0.38% on a daily basis, while marking a third consecutive trading day of gains. The daily high has been the highest level since July 29th 2004, when a high of 1.3369 was registered.
At 8:47 GMT today USD/CAD was gaining 0.10% for the day to trade at 1.3335. The pair tested the daily R2 level, as it touched a daily high at 1.3338 at 8:28 GMT.
Today the cross may be influenced by a number of macroeconomic reports and other events as listed below.
Fundamentals
United States
Initial, Continuing Jobless Claims
The number of people in the United States, who filed for unemployment assistance for the first time during the business week ended on September 18th, probably increased to 271 000, according to market expectations, from 264 000 in the previous week. The latter has been the lowest number of claims since the business week ended on July 17th, when 255 000 claims were reported, or reaching a 40-year low.
The 4-week moving average, an indicator lacking seasonal effects, was 272 500, marking a decrease of 3 250 compared to the preceding weeks unrevised average.
The business week, which ended on September 11th has been the 28th consecutive week, when jobless claims stood below the 300 000 threshold.
Initial jobless claims number is a short-term indicator, reflecting lay-offs in the country. In case the number of claims met expectations or increased further, this would have a moderate bearish effect on the US dollar.
The number of continuing jobless claims probably decreased to the seasonally adjusted 2 235 000 during the business week ended on September 11th from 2 237 000 reported in the preceding week. The latter represented a drop by 26 000 compared to the revised up number of claims, reported in the business week ended on August 28th. This indicator reflects the actual number of people unemployed and currently receiving unemployment benefits, who filed for unemployment assistance at least two weeks ago.
The Department of Labor is to release the weekly report at 12:30 GMT.
Durable Goods Orders
Durable goods orders in the United States probably dropped 2.0% in August compared to a month ago, according to the median forecast by experts. If so, this would be the sharpest monthly decrease since December 2014, when orders were 3.7% lower. In July new orders for manufactured durable goods rose at a pace of 2.0%, a revision down from 2.2%, as reported previously.
In July, transportation equipment rose at a monthly rate of 4.7% to USD 83.2 billion, driven by a surge in aircraft orders.
Shipments of manufactured durable goods went up 1.0% to USD 243.2 billion in July. Unfilled orders for manufactured durable goods were up 0.2% to USD 1,197.5 billion, while inventories of manufactured durable goods were virtually unchanged at USD 402.1 billion. Non-defense new orders for capital goods rose 1.1% to USD 82.3 billion in July, according to data by the US Census Bureau.
Durable goods orders, as an indicator, gauge the strength of US manufacturing sector and represent a major portion of the nations factory orders. This is a closely watched report on manufacturing activity, because durable goods are the first type of goods to be affected by an economic downturn or upturn.
Durable goods orders, which exclude transportation, probably rose for a fifth consecutive month in August, up 0.1%, according to expectations. If so, it would be the slowest monthly rate of increase since February 2014, when this measure was up 0.1%. In July compared to June orders excluding transportation were up 0.4%, a revision down from a 0.6% surge as reported previously. Large ticket orders, such as automobiles for civil use or aircraft, are not present in the calculation, as their value may be in a wide range. This way the index provides a more reliable information in regard to orders for durable goods.
In case the general index decreased at a faster-than-projected pace, this would have a strong bearish effect on the US dollar. The US Census Bureau is scheduled to release the official data at 12:30 GMT.
New Home Sales
Sales of new single-family homes probably rose 1.6% to the seasonally adjusted annual rate of 515 000 in August, according to market expectations. If so, this would be the highest level of sales since May 2015, when a figure of 546 000 was reported. In July, the index of new home sales climbed 5.4% to the annual rate of 507 000 units. Sales in the Northeast rose for a third consecutive month in July and marked the largest increase (+23.1%), followed by sales in the West (+6.7%) and sales in the South (+5.8%). On the other hand, new home sales in the Midwest were down 6.9% in July.
The median sales price of new houses sold was USD 285 900 in July, while the average sales price was USD 361 600. The seasonally adjusted estimate of new houses for sale was 218 000 at the end of July, which represents a supply of 5.2 months at the current sales rate, according to the report by the US Census Bureau.
In case the index of new home sales showed a better-than-anticipated performance, this would support demand for the greenback. The Census Bureau is to report the official figure at 14:00 GMT.
Yellen statement
At 21:00 GMT Federal Reserve Chair Janet Yellen is expected to take a statement. Moderate-to-high volatility is usually present during her speeches.
Bond Yield Spread
The yield on Canadian 2-year government bonds went as high as 0.524% on September 23rd, after which it slid to 0.516% at the close to add 1.8 basis points (0.018 percentage point) compared to September 22nd.
The yield on US 2-year government bonds climbed as high as 0.711% on September 23rd, after which it fell to 0.707% at the close to add 2.9 basis points (0.029 percentage point) for the day.
The spread between 2-year US and 2-year Canadian bond yields, which reflects the flow of funds in a short term, widened to 0.191% on September 23rd from 0.180% on September 22nd. The September 23rd yield difference has been the largest one since September 18th, when the spread was 0.218%.
Meanwhile, the yield on Canadian 10-year government bonds soared as high as 1.503% on September 23rd, after which it closed at 1.491% to add 1.1 basis points (0.011 percentage point) compared to September 22nd.
The yield on US 10-year government bonds climbed as high as 2.173% on September 23rd, after which it slipped to 2.144% at the close to gain 1.2 basis points (0.012 percentage point) on a daily basis.
The spread between 10-year US and 10-year Canadian bond yields widened to 0.653% on September 23rd from 0.652% on September 22nd. The September 23rd yield difference has been the largest one since September 21st, when the spread was 0.656%.
Daily and Weekly Pivot Levels
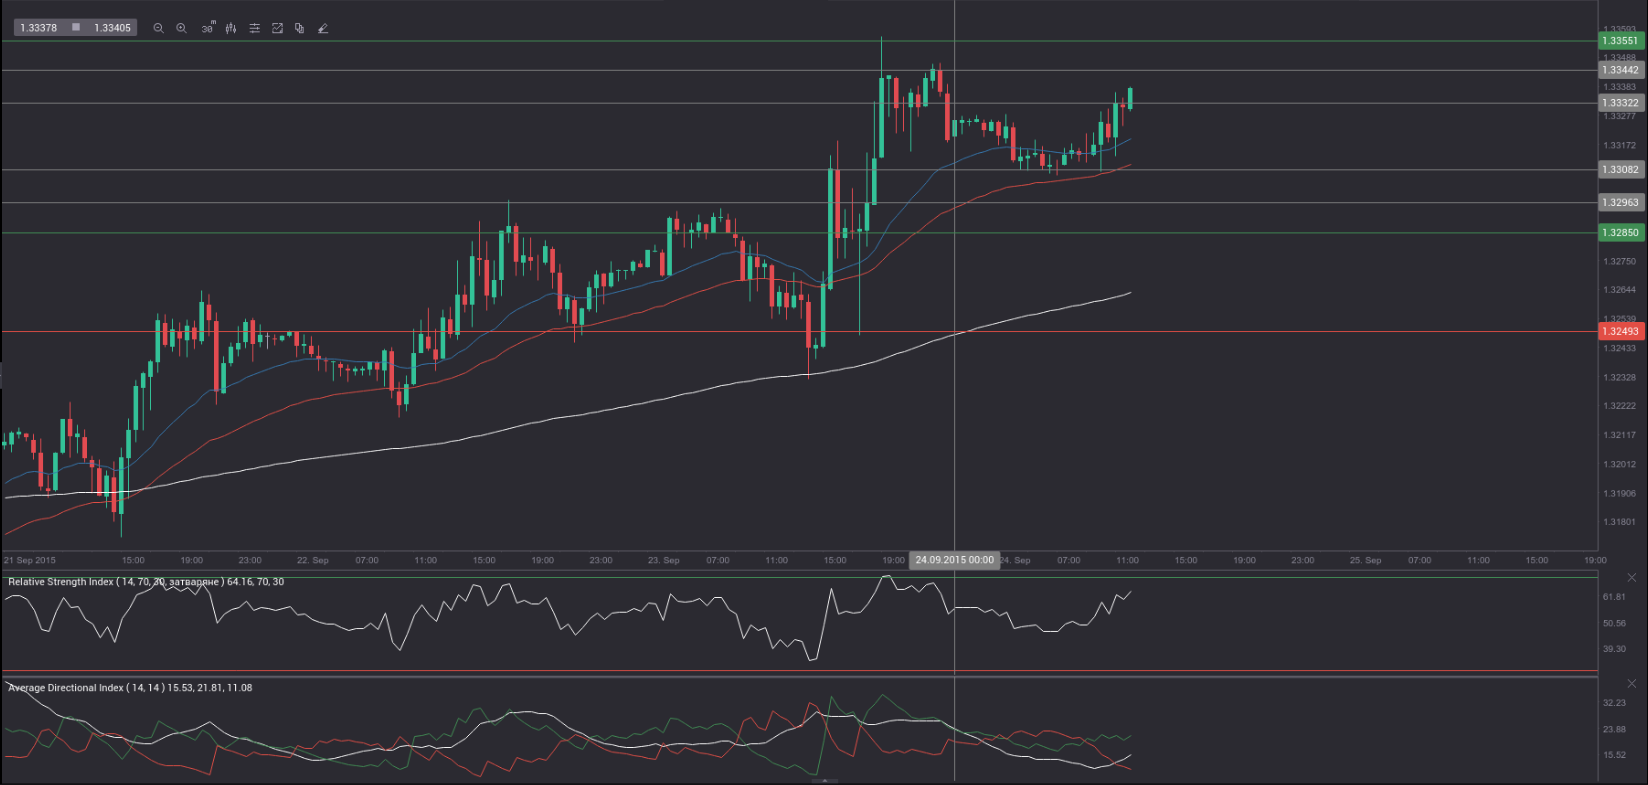
By employing the Camarilla calculation method, the daily pivot levels for USD/CAD are presented as follows:
R1 – 1.3332
R2 – 1.3344
R3 (range resistance – green on the 1-hour chart) – 1.3355
R4 (range breakout – red on the 1-hour chart) – 1.3391
S1 – 1.3308
S2 – 1.3296
S3 (range support – green on the 1-hour chart) – 1.3285
S4 (range breakout – red on the 1-hour chart) – 1.3249
By using the traditional method of calculation, the weekly pivot levels for USD/CAD are presented as follows:
Central Pivot Point – 1.3172
R1 – 1.3338
R2 – 1.3448
R3 – 1.3614
S1 – 1.3062
S2 – 1.2896
S3 – 1.2786