Yesterday’s trade saw EUR/USD within the range of 1.1283-1.1442. The pair closed at 1.1437, soaring 1.31% on a daily basis, or the most considerable daily gain since August 24th, when it appreciated 2.14%. The daily high has been the highest level since August 26th, when the cross registered a high of 1.1562.
At 6:56 GMT today EUR/USD was down 0.29% for the day to trade at 1.1401. The pair attempted to test the range support level (S4), as it touched a daily low at 1.1390 during early Asian trade.
Today the cross may be influenced by a number of macroeconomic reports as listed below.
Fundamentals
Euro area
Current Account
The surplus on Euro zones seasonally adjusted current account probably narrowed to EUR 21.3 billion in July, according to the median forecast by experts, from EUR 25.4 billion in June. The latter has been the largest figure since February 2015, when a surplus of EUR 26.4 billion was reported.
The regions current account (without a seasonal adjustment) had a surplus of EUR 31.1 billion in June, which has been the largest one since December 2014, when a figure of EUR 35.2 billion was recorded.
In case the surplus narrowed more than anticipated in July, this would have a limited bearish effect on the common currency. The European Central Bank is expected to publish the official numbers at 8:00 GMT.
United States
CB Leading Economic Indicator
The Conference Board Leading Economic Index for the United States probably increased 0.2% in August compared to a month ago, according to the median estimate by experts. In July the index unexpectedly dropped at a monthly rate of 0.2%. It has been the first decrease since March 2013, when a 0.2% slump was registered.
It encompasses a variety of economic indicators, which signify possible changes in overall economic activity. The index is comprised by the following components: average weekly hours in manufacturing, average weekly initial claims for unemployment insurance, manufacturers’ new orders, consumer goods and materials, ISM Index of New Orders, manufacturers new orders, nondefense capital goods excluding aircraft orders, building permits, new private housing units, Stock prices, 500 common stocks, Leading Credit Index, interest rate spread, 10-year Treasury bonds less federal funds, average consumer expectations for business conditions. Better-than-expected performance of the index is usually dollar positive. The Conference Board will release the official data at 14:00 GMT.
Feds rate decision
The US dollar lost ground against most of its major peers yesterday, after the Federal Reserve decided to leave the target range for the federal funds rate unchanged at 0 to 0.25%, stressing on concerns that global economic and financial developments may curb economic activity and suppress consumer price inflation even further in a short term.
According to extracts from the FOMC Statement, released yesterday: “Recent global economic and financial developments may restrain economic activity somewhat and are likely to put further downward pressure on inflation in the near term. Nonetheless, the Committee expects that, with appropriate policy accommodation, economic activity will expand at a moderate pace, with labor market indicators continuing to move toward levels the Committee judges consistent with its dual mandate. The Committee continues to see the risks to the outlook for economic activity and the labor market as nearly balanced but is monitoring developments abroad.”
“To support continued progress toward maximum employment and price stability, the Committee today reaffirmed its view that the current 0 to 1/4 percent target range for the federal funds rate remains appropriate. In determining how long to maintain this target range, the Committee will assess progress–both realized and expected–toward its objectives of maximum employment and 2 percent inflation.”
“The Committee anticipates that it will be appropriate to raise the target range for the federal funds rate when it has seen some further improvement in the labor market and is reasonably confident that inflation will move back to its 2 percent objective over the medium term.”
Bond Yield Spread
The yield on German 2-year government bonds went as high as -0.191% on September 17th, or the highest level since September 1st (-0.186%), after which it slid to -0.211% at the close to lose 0.004 percentage point on a daily basis.
The yield on US 2-year government bonds climbed as high as 0.815% on September 17th, after which it fell to 0.686% at the close to lose 12.5 basis points (0.125 percentage point) for the day. It has been the first drop in the past four trading days.
The spread between 2-year US and 2-year German bond yields, which reflects the flow of funds in a short term, shrank to 0.897% on September 17th from 1.018% during the prior day. The September 17th yield spread has been the lowest one since August 25th, when the difference was 0.833%.
Meanwhile, the yield on German 10-year government bonds soared as high as 0.791% on September 17th, after which it slid to 0.775% at the close to lose 0.004 percentage point compared to September 16th. It has been the first decrease in the past four trading days.
The yield on US 10-year government bonds climbed as high as 2.298% on September 17th, after which it slipped to 2.196% at the close to lose 10 basis points (0.100 percentage point) on a daily basis. It has been the first decrease in the past three trading days.
The spread between 10-year US and 10-year German bond yields narrowed to 1.421% on September 17th from 1.517% during the prior day. The September 17th yield difference has been the lowest one since September 2nd, when the spread was 1.393%.
Daily and Weekly Pivot Levels
By employing the Camarilla calculation method, the daily pivot levels for EUR/USD are presented as follows:
R1 – 1.1452
R2 – 1.1466
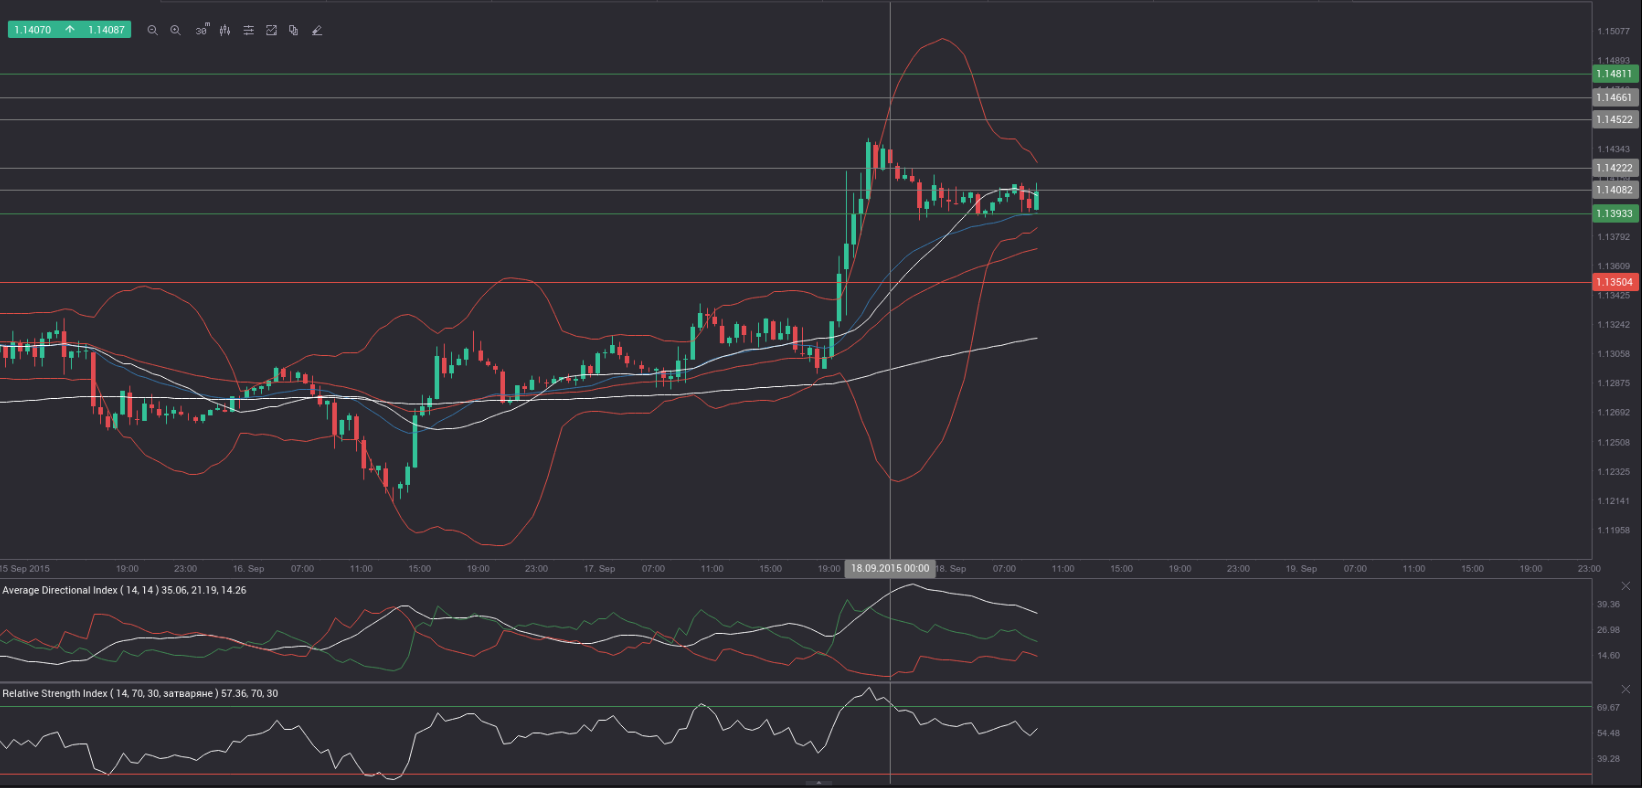
R3 (range resistance – green on the 30-minute chart) – 1.1481
R4 (range breakout – red on the 30-minute chart) – 1.1524
S1 – 1.1422
S2 – 1.1408
S3 (range support – green on the 30-minute chart) – 1.1393
S4 (range breakout – red on the 30-minute chart) – 1.1350
By using the traditional method of calculation, the weekly pivot levels for EUR/USD are presented as follows:
Central Pivot Point – 1.1270
R1 – 1.1419
R2 – 1.1499
R3 – 1.1648
S1 – 1.1190
S2 – 1.1041
S3 – 1.0961