Yesterday’s trade saw USD/CAD within the range of 1.3176-1.3307. The pair closed at 1.3198, down 0.71% on a daily basis, while extending losses from Wednesday. The daily rate of decline has also been the sharpest one since August 12th, when the cross slumped 1.04%.
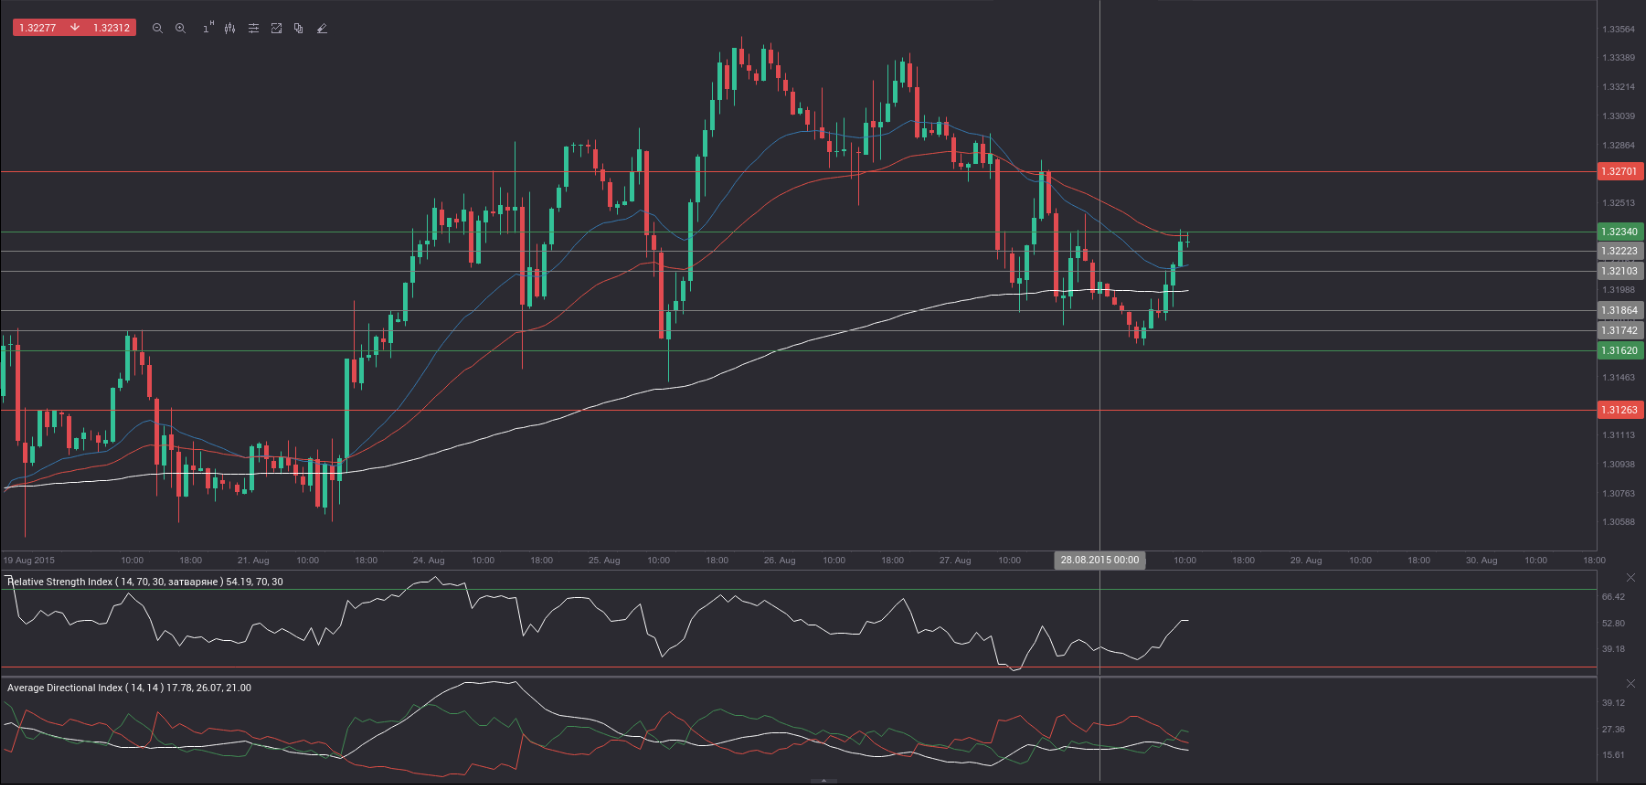
At 8:49 GMT today USD/CAD was gaining 0.24% for the day to trade at 1.3232. The pair tested the range resistance level (R3), as it touched a daily high at 1.3236 at 8:41 GMT, or the highest level since Wednesday, when a high of 1.3350 was reached.
Today the cross may be influenced by a number of macroeconomic reports as listed below.
Fundamentals
United States
Personal Income, Personal Spending
Personal spending in the United States probably rose for a third straight month in July, up 0.4%, according to market expectations, while personal income was probably up for a fourth consecutive month in July, increasing at a monthly rate of 0.4%. Spending rose 0.2% in June. Personal consumption expenditures (PCE) were up USD 25.9 billion, or 0.2%, in June.
At the same time, personal income increased 0.4% during the same month, while disposable personal income (DPI) rose USD 60.6 billion (or 0.5%). Private wages and salaries increased USD 16.0 billion in June, compared to a surge by USD 29.6 billion in May. Government wages and salaries went up by USD 2.3 billion, following a USD 2.4 billion increase in the preceding month.
Higher-than-expected rates of increase imply good employment conditions and, therefore, are dollar positive. The Bureau of Economic Analysis is to publish the official figures at 12:30 GMT.
Reuters/Michigan Consumer Sentiment Index – final reading
The monthly survey by Thomson Reuters and the University of Michigan may show that consumer confidence in the United States lowered for a second consecutive month in August. The final reading of the corresponding index, which usually comes out two weeks after the preliminary data, probably came in at 93.0, up from a preliminary value of 92.9, reported on August 14th. In July the gauge of confidence came in at a final reading of 93.1, down from a preliminary value of 93.3. The survey encompasses about 500 respondents throughout the country. The index is comprised by two major components, a gauge of current conditions and a gauge of expectations. The current conditions index is based on the answers to two standard questions, while the index of expectations is based on three standard questions. All five questions have an equal weight in determining the value of the overall index.
According to preliminary data, the sub-index of current economic conditions, which measures US consumers’ views of their personal finances, decreased to a reading of 107.1 in August from a final 107.2 in July. The sub-index of consumer expectations plunged to a flash reading of 83.8 in August, down from a final value of 84.1 in July.
In case the gauge of consumer sentiment showed a larger decrease than anticipated, this would have a moderate bearish effect on the US dollar. The final reading is due out at 14:00 GMT.
Canada
Industrial Producer Price Index
Prices of industrial products in Canada probably remained unchanged in July, according to market expectations, following a 0.5% gain in May and June. This index measures the change in prices of industrial goods, sold by manufacturers in the country. It is also used as an indicator of commodity inflation. In case the median forecast by experts is exceeded, the local dollar would receive a limited support. Statistics Canada is to release the official data at 12:30 GMT.
Correlation with other Major pairs
Taking into account the week ended on August 23rd and the daily closing levels of the major currency pairs, we come to the following conclusions in regard to the strength of relationship:
USD/CAD to EUR/USD (0.8341, or very strong)
USD/CAD to NZD/USD (0.7965, or strong)
USD/CAD to GBP/USD (0.5528, or strong)
USD/CAD to AUD/USD (-0.5936, or strong)
USD/CAD to USD/CHF (-0.8578, or very strong)
USD/CAD to USD/JPY (-0.9008, or very strong)
1. During the examined period USD/CAD moved almost equally in one and the same direction with EUR/USD, while moving almost equally in the opposite direction compared to USD/CHF and USD/JPY.
2. USD/CAD moved strongly in one and the same direction with NZD/USD and GBP/USD, while moving to a great extent in the opposite direction compared to AUD/USD during the past week.
Bond Yield Spread
The yield on Canadian 2-year government bonds went as high as 0.417% on August 27th, or the highest level since August 19th (0.421%), after which it slid to 0.404% at the close to add 1.2 basis points (0.012 percentage point) on a daily basis. It has been the third consecutive trading day of gains.
The yield on US 2-year government bonds climbed as high as 0.715% on August 27th, or the highest level since August 19th (0.738%), after which it fell to 0.700% at the close to add 2 basis points (0.02 percentage point) for the day. It has been a third consecutive trading day of gains.
The spread between 2-year US and 2-year Canadian bond yields, which reflects the flow of funds in a short term, expanded to 0.296% on August 27th from 0.288% during the prior day. The August 27th yield spread has been the most notable one since August 20th, when the difference was 0.304%.
Meanwhile, the yield on Canadian 10-year government bonds soared as high as 1.468% on August 27th, or the highest level since August 10th (1.480%), after which it slid to 1.465% at the close to appreciate 2.4 basis points (0.024 percentage point) compared to August 26th, while marking a third straight day of gains.
The yield on US 10-year government bonds climbed as high as 2.207% on August 27th, or the highest level since August 19th (2.230%), after which it slipped to 2.195% at the close to add 1.5 basis points (0.015 percentage point) on a daily basis, while marking a third consecutive day of gains.
The spread between 10-year US and 10-year Canadian bond yields narrowed to 0.730% on August 27th from 0.739% during the prior day. The August 27th yield difference has been the lowest one since August 3rd, when the spread was 0.709%.
Daily and Weekly Pivot Levels
By employing the Camarilla calculation method, the daily pivot levels for USD/CAD are presented as follows:
R1 – 1.3210
R2 – 1.3222
R3 (range resistance – green on the 1-hour chart) – 1.3234
R4 (range breakout – red on the 1-hour chart) – 1.3270
S1 – 1.3186
S2 – 1.3174
S3 (range support – green on the 1-hour chart) – 1.3162
S4 (range breakout – red on the 1-hour chart) – 1.3126
By using the traditional method of calculation, the weekly pivot levels for USD/CAD are presented as follows:
Central Pivot Point – 1.3132
R1 – 1.3243
R2 – 1.3301
R3 – 1.3412
S1 – 1.3074
S2 – 1.2963
S3 – 1.2905