Yesterday’s trade saw USD/JPY within the range of 124.06-124.64. The pair closed at 124.42, soaring 0.17% on a daily basis, or the smallest daily gain since July 30th, when it added 0.16%. On Wednesday the cross went up as high as 125.29, or a level unseen since June 8th.
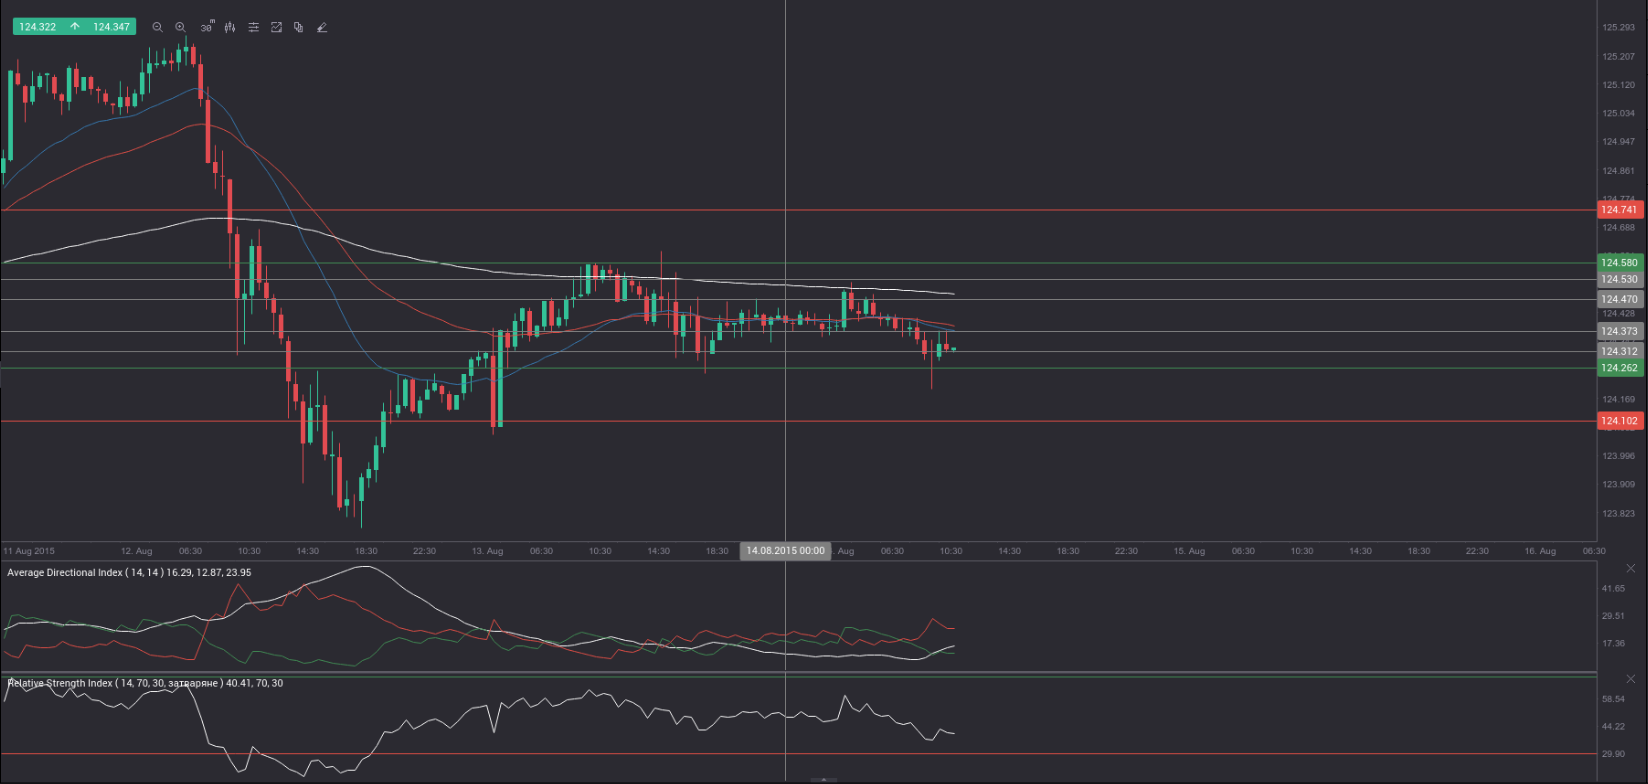
At 8:20 GMT today USD/JPY was down 0.08% for the day to trade at 124.34. The pair is set to test the lower range breakout level (S4), as it touched a daily low at 124.21 at 7:14 GMT, overshooting the range support (S3).
Today the cross may be influenced by a number of macroeconomic reports as listed below.
Fundamentals
United States
Producer prices
Annual producer prices in the United States probably fell for a sixth month in a row in July, by 0.9%, according to the median estimate by experts. In June the annualized Producer Price Index decreased 0.7%. This index reflects the change in prices of over 8 000 products, sold by manufacturers during the respective period. The Producer Price Index (PPI) differs from the Consumer Price Index (CPI), which measures the change in prices from consumer’s perspective, due to subsidies, taxes and distribution costs of different types of manufacturers in the country. The simple logic behind this indicator is that if producers are forced to pay more for goods and services, they are more likely to pass these higher costs to the end consumer. Therefore, the PPI is considered as a leading indicator of consumer inflation. In case annual producer prices fell at a sharper rate than anticipated, this would usually have a bearish effect on the greenback.
The nation’s annualized core producer price inflation, which excludes prices of volatile categories such as food and energy, probably slowed down to 0.5% in July from 0.8% in the prior month. If so, this would be the lowest annual rate of increase in the PPI in at least 8 years. This indicator is quite sensitive to changes in aggregate demand, thus, it can be used as a leading indicator for economy. However, because of its restrained scope, it is not suitable for future inflation forecasts. The Bureau of Labor Statistics is expected to report on the official PPI performance at 12:30 GMT.
Industrial production, Capacity Utilization
Industrial output in the United States probably expanded 0.3% in July compared to June, following a revised down monthly growth rate of 0.2% in June (0.3% previously). Manufacturing production shrank 0.1% in June, after being reported as unchanged in the initial estimate. The index for mining went up 1.0% in June, due to an increase in crude oil extraction. The output of utilities rose 1.5% in June compared to a month ago.
The index of industrial production reflects the change in overall inflation-adjusted value of output in the three major sectors mentioned above. The index is sensitive to consumer demand and interest rates. As such, industrial production is an important tool for future GDP and economic performance forecasts. Those figures are also used to measure inflation by central banks as very high levels of industrial production may lead to uncontrolled levels of consumption and rapid inflation. It is a coincident indicator, which means that changes in its levels generally echo similar shifts in overall economic activity. A larger-than-projected increase in the index would usually boost demand for the US dollar.
The Board of Governors of the Federal Reserve is to release the production data at 13:15 GMT.
In addition, Capacity Utilization rate in the country probably decreased to 78.0% in July from 78.4% in June. If so, this would be the lowest utilization rate since August 2013, when a rate of 77.9% was reported. This indicator represents the optimal rate for a stable production process, or the highest possible level of production in an enterprise, in case it operates within a realistic work schedule and has sufficient raw materials and inventories at its disposal. High rates of capacity utilization usually lead to inflationary pressure. In general, lower-than-anticipated rates tend to have a limited bearish effect on the US dollar.
Bond Yield Spread
The yield on Japanese 2-year government bonds went as high as 0.009% on August 13th, or the highest level since August 11th (0.013%), after which it slid to 0.005% at the close to lose 0.001 percentage point on a daily basis, while marking a third consecutive day of decrease.
The yield on US 2-year government bonds climbed as high as 0.717% on August 13th, or the highest level since August 11th (0.729%), after which it closed at the same level to gain 4.8 basis points (0.048 percentage point) for the day. It has been the first gain in the past three trading days.
The spread between 2-year US and 2-year Japanese bond yields, which reflects the flow of funds in a short term, widened to 0.712% on August 13th from 0.663% during the prior day. The August 13th spread has been the most notable one since August 10th, when the difference was 0.718%.
Meanwhile, the yield on Japans 10-year government bonds soared as high as 0.388% on August 13th, or the highest level since August 11th (0.420%), after which it slid to 0.361% at the close to lose 0.005 percentage point compared to August 12th, while marking a fifth straight day of decrease.
The yield on US 10-year government bonds climbed as high as 2.198% on August 13th, or the highest level since August 11th (2.232%), after which it slipped to 2.185% at the close to add 3.7 basis points (0.037 percentage point) on a daily basis, while marking a second consecutive day of gains.
The spread between 10-year US and 10-year Japanese bond yields widened to 1.824% on August 13th from 1.782% during the prior day. The August 13th yield difference has been the largest one since August 10th, when the spread was 1.824% as well.
Daily and Weekly Pivot Levels
By employing the Camarilla calculation method, the daily pivot levels for USD/JPY are presented as follows:
R1 – 124.47
R2 – 124.53
R3 (range resistance – green on the 30-minute chart) – 124.58
R4 (range breakout – red on the 30-minute chart) – 124.74
S1 – 124.37
S2 – 124.31
S3 (range support – green on the 30-minute chart) – 124.26
S4 (range breakout – red on the 30-minute chart) – 124.10
By using the traditional method of calculation, the weekly pivot levels for USD/JPY are presented as follows:
Central Pivot Point – 124.36
R1 – 124.94
R2 – 125.67
R3 – 126.25
S1 – 123.63
S2 – 123.05
S3 – 122.32