Yesterday’s trade saw USD/JPY within the range of 123.77-125.29. The pair closed at 124.21, down 0.74% on a daily basis, or the most considerable daily loss since July 8th, when it depreciated 1.51%. The daily high has also been the highest level since June 8th, when the cross registered a high of 125.69.
At 8:55 GMT today USD/JPY was up 0.29% for the day to trade at 124.56. The pair is set to test the range resistance level (R3), as it touched a daily high at 124.60 at 8:00 GMT.
Today the cross may be influenced by a number of macroeconomic reports as listed below.
Fundamentals
United States
Retail Sales
Retail sales in the United States probably rose 0.5% in July on a monthly basis, according to the median forecast by experts. In June sales recorded an unexpected 0.3% drop, or the first monthly decline since February, when the index slipped 0.5%. The June result was due to lower sales of automobiles and an array of other goods.
Among the 13 major categories, 7 registered decreases, while 1 showed no change. Sales of furniture fell at the steepest rate in June (-1.6%), followed by sales of clothing and footwear (-1.5%), building materials and garden equipment (-1.3%) and motor vehicles (-1.1%). On the other hand, sales at electronics and appliance stores surged 1%, sales at gasoline stations were up 0.8%, while sales of sporting goods, hobby, music and books were up 0.1%, according to the report by the US Census Bureau.
Annualized retail sales surged 1.4% in June, following a 2.3% climb in May. The latter has been the most considerable annual increase since January, when retail sales rose 3.7%.
The report on retail sales reflects the dollar value of merchandise sold within the retail trade by taking a sampling of companies, operating in the sector of selling physical end products to consumers. The retail sales report encompasses both fixed point-of-sale businesses and non-store retailers, such as mail catalogs and vending machines. The Census Bureau, which is a part of the Department of Commerce, surveys about 5 000 companies of all sizes, from huge retailers such as Wal-Mart to independent small family firms.
US core retail sales, or retail sales ex autos, probably went up 0.5% in July compared to a month ago. In June core sales dipped 0.1%, which followed three consecutive months of increases. This indicator removes large ticket prices and historical seasonality of automobile sales.
The retail sales index is considered as a coincident indicator, thus, it reflects the current state of the economy. It is also considered a pre-inflationary indicator, which investors can use in order to reassess the probability of an interest rate hike or cut by the Federal Reserve Bank. In addition, this indicator provides key information regarding consumer spending trends. Consumer expenditures, on the other hand, account for almost two-thirds of the US Gross Domestic Product. Therefore, a larger-than-expected rate of increase in sales would certainly boost the US dollar. The official report is due out at 12:30 GMT.
Initial, Continuing Jobless Claims
The number of people in the United States, who filed for unemployment assistance for the first time during the business week ended on August 7th, probably remained unchanged at 270 000, according to market expectations.
The business week, which ended on July 31st has been the 22nd consecutive week, when jobless claims stood below the 300 000 threshold. This boosts the case labor market conditions in the country continued to improve. Claims are usually volatile during the summer period, as automakers shut assembly plants for annual retooling and also due to school vacations.
The 4-week moving average, an indicator lacking seasonal effects, was 268 250, marking a decrease of 6 500 compared to the preceding weeks unrevised average.
Initial jobless claims number is a short-term indicator, reflecting lay-offs in the country. In case the number of claims met expectations or dropped further, this would have a bullish effect on the US dollar.
The number of continuing jobless claims probably decreased to the seasonally adjusted 2 247 000 during the business week ended on July 31st from 2 255 000 in the prior week. The latter represented a decrease by 14 000 compared to the revised up number of claims, reported in the week ended on July 24th. This indicator reflects the actual number of people unemployed and currently receiving unemployment benefits, who filed for unemployment assistance at least two weeks ago.
The Department of Labor is to release the weekly report at 12:30 GMT.
Bond Yield Spread
The yield on Japanese 2-year government bonds went as high as 0.007% on August 12th, after which it closed at the same level to lose 0.002 percentage point on a daily basis, while marking the second consecutive day of decrease.
The yield on US 2-year government bonds climbed as high as 0.681% on August 12th, after which it fell to 0.665% at the close to lose 1.2 basis points (0.012 percentage point) for the day, while marking a second consecutive day of decline.
The spread between 2-year US and 2-year Japanese bond yields, which reflects the flow of funds in a short term, shrank a second day in a row on August 12th to reach 0.658% from 0.668% during the prior day. The August 12th spread has been the lowest one since August 3rd, when the difference was 0.654%.
Meanwhile, the yield on Japans 10-year government bonds soared as high as 0.402% on August 12th, after which it slid to 0.397% at the close to lose 0.004 percentage point compared to August 11th, while marking a fourth straight day of decline.
The yield on US 10-year government bonds climbed as high as 2.157% on August 12th, after which it slipped to 2.141% at the close to lose 0.002 percentage point on a daily basis, while marking a second consecutive day of decline.
The spread between 10-year US and 10-year Japanese bond yields widened to 1.744% on August 12th from 1.742% during the prior day. The August 12th yield difference has been the largest one since August 10th, when the spread was 1.824%.
Daily and Weekly Pivot Levels
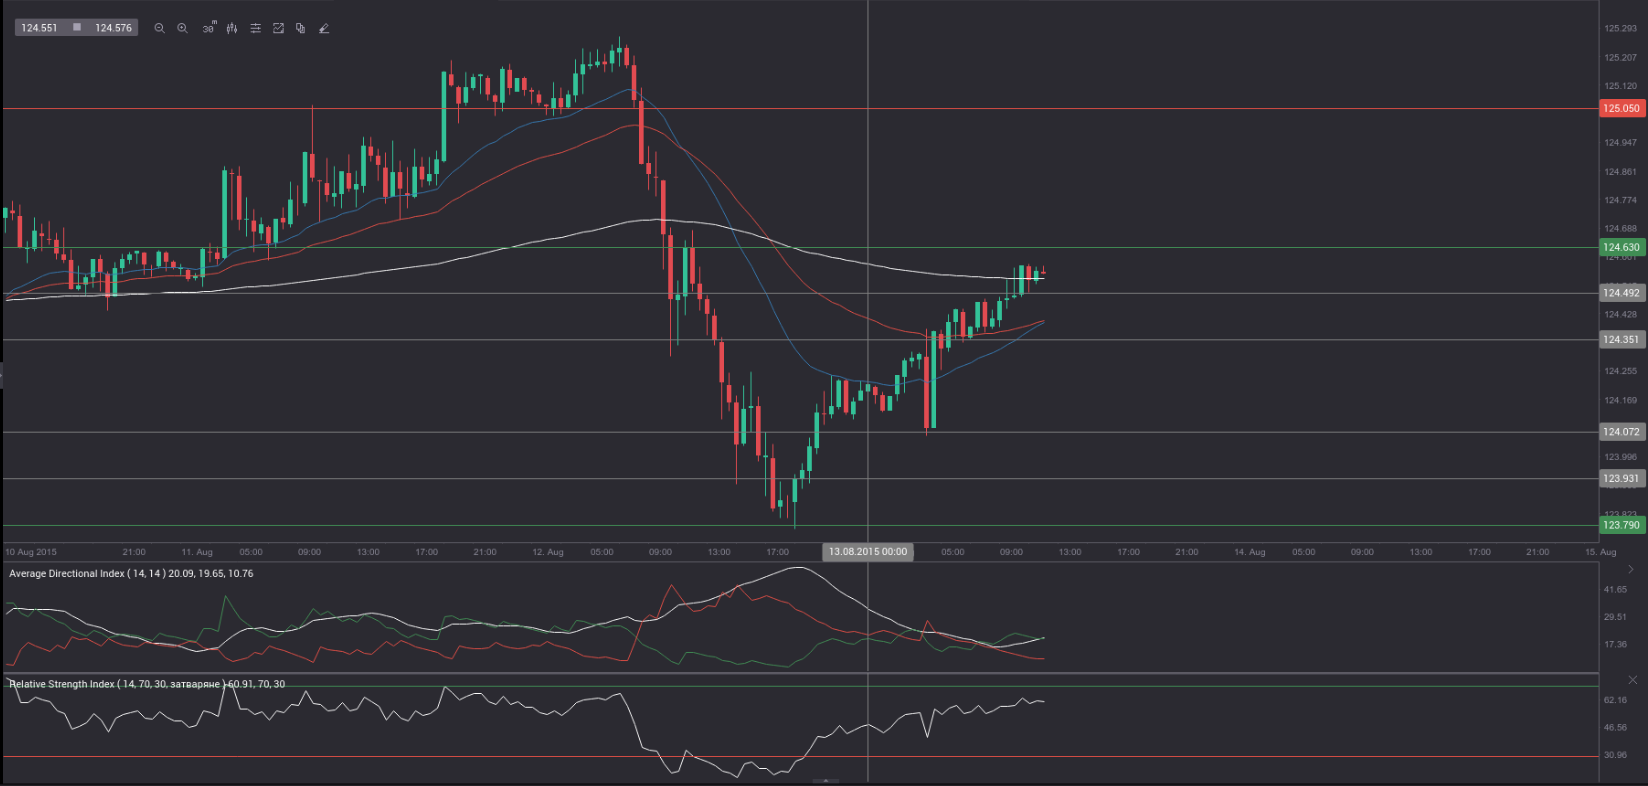
By employing the Camarilla calculation method, the daily pivot levels for USD/JPY are presented as follows:
R1 – 124.35
R2 – 124.49
R3 (range resistance – green on the 30-minute chart) – 124.63
R4 (range breakout – red on the 30-minute chart) – 125.05
S1 – 124.07
S2 – 123.93
S3 (range support – green on the 30-minute chart) – 123.79
S4 (range breakout – red on the 30-minute chart) – 123.37
By using the traditional method of calculation, the weekly pivot levels for USD/JPY are presented as follows:
Central Pivot Point – 124.36
R1 – 124.94
R2 – 125.67
R3 – 126.25
S1 – 123.63
S2 – 123.05
S3 – 122.32