Yesterday’s trade saw EUR/USD within the range of 1.0968-1.1084. The pair closed at 1.0982, down 0.70% on a daily basis, while extending losses from Tuesday. It has been the most considerable daily loss since July 13th, when it depreciated 1.14%.
At 7:08 GMT today EUR/USD was down 0.21% for the day to trade at 1.0960. The pair touched a daily low at 1.0942 at 6:36 GMT. It has been the lowest level since July 24th, when a low of 1.0924 was registered.
Today the cross may be influenced by a number of macroeconomic reports as listed below.
Fundamentals
Euro area
German Unemployment Rate
The number of the unemployed people in Germany probably dropped by 5 000 in July, according to the median forecast by experts, following a decrease by 1 000 reported in May. If so, this would be the tenth consecutive month of declines. A decrease implies that consumer spending may be more active, while the latter is tightly related to economic growth. An increase in the number of the unemployed suggests the opposite.
At the same time, the seasonally adjusted rate of unemployment in the country probably remained unchanged at 6.4% for the fifth straight month in July, according to expectations. This has been the lowest rate on record.
The seasonally adjusted harmonized jobless rate stood at 4.7% for a fourth month in a row in May. The number of unemployed persons dropped 0.5% to 1.97 million in May compared to April, while employment was almost unchanged at 39.88 million persons in May.
The unemployment rate for people aged between 15 and 24 was steady at 7.1% in May, while falling from 7.8% in May 2014.
In case the number of people unemployed decreased more than projected and the unemployment rate dropped, this would certainly support demand for the common currency. The Federal Statistics Office will release the official numbers at 7:55 GMT.
Euro Area Economic Sentiment Indicator
The final value of the consumer confidence index probably confirmed the preliminary reading of -7.1 in July, which was reported on July 23rd. If so, this would be the lowest level of confidence since January 2015, when the indicator stood at a final -8.5. The final index for June came in at -5.6, or in line with the preliminary value. The indicator measures consumer confidence on a scale of -100 to +100. A reading of -100 suggests a lack of confidence, zero means neutrality and a reading of +100 indicates extreme levels of confidence. The index reflects the level of optimism, which consumers have about economic development in the region. The Business and Consumer Survey is conducted by phone and includes 23 000 households in the Euro area. The questions asked stress on current economic and financial situation, savings intention and also on expected developments regarding consumer price indexes, general economic situation and major purchases of durable goods. This indicator is one of the five major components, that comprise the Economic Sentiment Indicator (ESI).
The ESI probably dipped a second straight month in July, reaching 103.3, according to expectations, from a reading of 103.5 in Jine. If so, this would be the lowest level since February, when the index was reported at 102.3. The Economic Sentiment Indicator (ESI) is a composite indicator, consisting of five sectoral confidence indicators with different weights: Industrial confidence indicator, Services confidence indicator, Consumer confidence indicator, Construction confidence indicator and Retail trade confidence indicator. The ESI is calculated as an index with a mean value of 100.0 and standard deviation of 10 over a fixed standardized sample period.
Lower confidence usually implies lesser willingness to spend, including large-ticket purchases, while consumer spending is a key factor behind economic growth. Therefore, in case the ESI fell more than anticipated, this would cause a moderate bearish impact on the euro. The European Commission is expected to release the official ESI reading at 9:00 GMT.
German consumer inflation – preliminary estimate
German preliminary annualized consumer inflation probably remained steady at 0.3% during July, according to the median forecast by analysts. It has been the lowest annual level since March, when a final rate of 0.3% was reported. Junes inflation was driven by a further decrease in energy costs and a slowdown in prices of food and services.
Energy costs went down 5.9% year-on-year in June, as prices of heating oil plunged 19.2% and prices of motor fuels dropped 7.8%. Prices of other energy products were also down, namely charges for central and district heating (-5.2%) and electricity (-0.9%). On the other hand, prices of solid fuels went up 1.1% year-on-year, according to the report by Destatis. Last month prices of food and non-alcoholic beverages were 1.0% higher compared to June 2014.
The Consumer Price Index (CPI) presents a general picture of the price change in the country, while encompassing all household types, all regions and all goods and services demanded (food, clothing, automobiles, rental, repair and hairdressing services etc). The index is based on a basket of goods and services, which is regularly renewed, so that goods and services, purchased more often by consumers, are included in the present survey.
The nations preliminary annualized CPI, evaluated in accordance with the harmonized methodology, probably rose 0.1% in July, after another 0.1% increase in June. It has been the lowest annual harmonized inflation since March this year. The harmonized methodology is used for the sake of consumer inflation comparison in an international context (member states in the Euro area). In case the annualized CPI advanced more than expected and further approached the 2-percent inflation objective, set by the European Central Bank, this would have a moderate-to-strong bullish effect on the euro. Destatis is scheduled to publish the CPI report at 12:00 GMT.
United States
Initial, Continuing Jobless Claims
The number of people in the United States, who filed for unemployment assistance for the first time during the week ended on July 24th, probably increased to 270 000, according to market expectations, from 255 000 in the prior week. The latter has been the lowest number of claims since November 1973 The 4-week moving average, an indicator lacking seasonal effects, was 278 500, marking a decrease of 4 000 compared to the preceding weeks unrevised average.
Jobless claims are usually more volatile during the summer period, as a number of plants close, mostly automakers, and also due to school vacations. Since the first week of March the number of claims has been below the 300 000 level, which suggests an improving labor market.
Initial jobless claims number is a short-term indicator, reflecting lay-offs in the country. In case the number of claims dropped more than projected, this would have a bullish effect on the US dollar.
The number of continuing jobless claims probably rose to the seasonally adjusted 2 211 000 during the week ended on July 17th from 2 207 000 in the prior week. The latter has been the lowest number of continuing jobless claims since the week ended on May 22nd, when 2 196 000 claims were reported. It also represented a decrease by 9 000 compared to the revised up number of claims, reported in the week ended on July 3rd. This indicator reflects the actual number of people unemployed and currently receiving unemployment benefits, who filed for unemployment assistance at least two weeks ago.
The Department of Labor is to release the weekly report at 12:30 GMT.
Gross Domestic Product – preliminary estimate
The preliminary estimate of the US Gross Domestic Product probably pointed to an annualized rate of growth of 2.6% in the second quarter of the year. The final GDP estimate for Q1, reported on June 26th, pointed to an annual growth of -0.2%. The latter missed the second GDP estimate, which pointed to a deeper contraction (-0.7%). It has also been the first GDP decline since Q1 2014, when economy shrank at an annualized pace of 2.1%. The decline in real GDP in Q1 primarily reflected negative contributions from exports, non-residential fixed investment, and state and local government spending. This negative influence was partly offset by positive contributions from Personal Consumption Expenditures, private inventory investment and residential fixed investment.
Real personal consumption expenditures rose 2.1% in the first quarter, compared with an increase of 4.4% in Q4 2014. Real non-residential fixed investment dropped 2.0% in the first quarter, compared to an increase of 4.7% during the fourth quarter of 2014. Real exports of goods and services went down 5.9% in the first quarter, following an increase of 4.5% in Q4 2014, while real imports of goods and services rose 7.1% in Q1, after another 10.4% surge in the preceding quarter. Real federal government consumption expenditures and gross investment remained unchanged in the first quarter, following a decrease of 7.3% in Q4 2014, according to the report by the Bureau of Economic Analysis.
In case the preliminary GDP estimate outpaced expectations, this would certainly heighten the appeal of the US dollar. The preliminary data is due out at 12:30 GMT.
Bond Yield Spread
The yield on German 2-year government bonds went as high as -0.217% on July 29th, after which it slid to -0.237% at the close to lose 0.006 percentage point on a daily basis, while marking a third straight day of decrease.
The yield on US 2-year government bonds climbed as high as 0.724% on July 29th, or the highest level since July 23rd (0.727%), after which it fell to 0.712% at the close to gain 4.2 basis points (0.042 percentage point) for the day, while marking a second daily increase in a row.
The spread between 2-year US and 2-year German bond yields, which reflects the flow of funds in a short term, expanded to 0.949% on July 29th from 0.901% during the prior day. The July 29th yield spread has been the most notable one in at least two months.
Meanwhile, the yield on German 10-year government bonds soared as high as 0.731% on July 29th, after which it slid to 0.718% at the close to appreciate 2.6 basis points (0.026 percentage point) compared to July 28th, while marking the first gain in the past six trading days.
The yield on US 10-year government bonds climbed as high as 2.297% on July 29th, or the highest level since July 23rd (2.343%), after which it closed at the same level to add 4.7 basis points (0.047 percentage point) on a daily basis, while marking a second consecutive day of gains.
The spread between 10-year US and 10-year German bond yields expanded to 1.579% on July 29th from 1.558% during the prior day. The July 29th yield difference has been the largest one since July 22nd, when the spread was 1.580%.
Daily and Weekly Pivot Levels
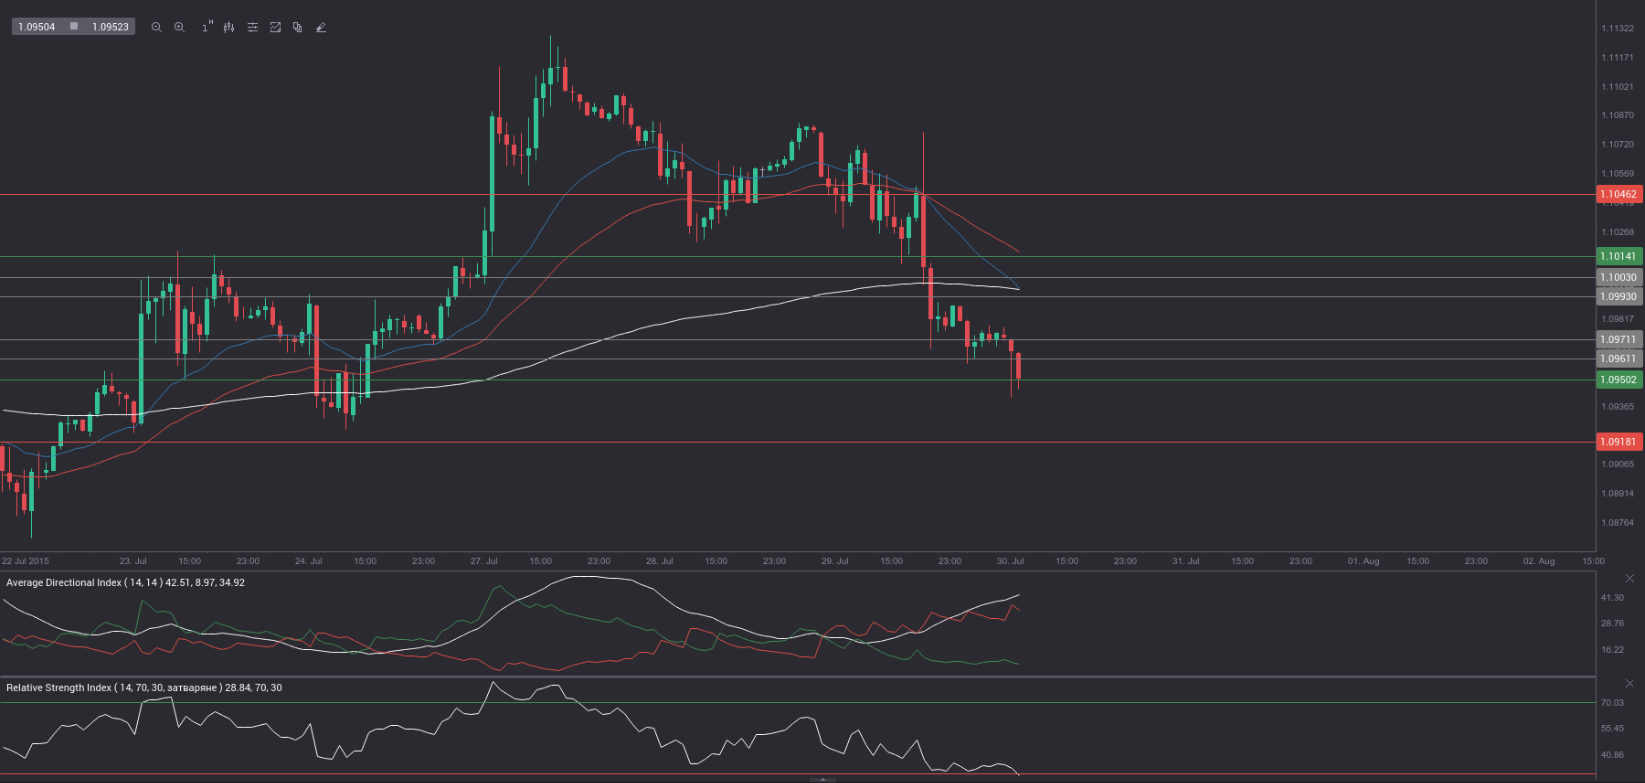
By employing the Camarilla calculation method, the daily pivot levels for EUR/USD are presented as follows:
R1 – 1.0993
R2 – 1.1003
R3 (range resistance – green on the 1-hour chart) – 1.1014
R4 (range breakout – red on the 1-hour chart) – 1.1046
S1 – 1.0971
S2 – 1.0961
S3 (range support – green on the 1-hour chart) – 1.0950
S4 (range breakout – red on the 1-hour chart) – 1.0918
By using the traditional method of calculation, the weekly pivot levels for EUR/USD are presented as follows:
Central Pivot Point – 1.0951
R1 – 1.1077
R2 – 1.1323
R3 – 1.1449
S1 – 1.0705
S2 – 1.0579
S3 – 1.0333