Join our community of traders FOR FREE!

  • Learn
  • Improve yourself
  • Get Rewards
Learn More

Yesterday’s trade saw CAD/MXN within the range of 11.9126-11.9964. The pair closed at 11.9719, gaining 0.23% on a daily basis.

At 7:53 GMT today CAD/MXN was down 0.03% for the day to trade at 11.9681. The pair touched a daily low at 11.9617 at 4:10 GMT.

Fundamental view

Canada

Manufacturing sales in Canada probably increased 1.0% in July compared to June, according to market expectations, following another 0.6% in June. The Monthly Survey of Manufacturing features statistical data regarding sales of finished goods, inventories, unfilled orders and new orders in Canadian sector of manufacturing. About 10 500 items and 27 000 companies are encompassed.

Manufacturing sales are considered as an indicator of demand in the future. An increase in the number of goods and unsold inventories suggests, that demand is not sufficient and vice versa. On the other hand, an increase in sales (shipments) speaks of strong demand. Therefore, in case shipments rose at a higher than projected pace, this would provide support to the loonie. Statistics Canada will release the manufacturing data at 12:30 GMT.

In addition, at 16:30 GMT Bank of Canada Governor Stephen Poloz is expected to take a statement. He took office in June 2013 for a mandate of seven years.

Technical view

cad-mxn

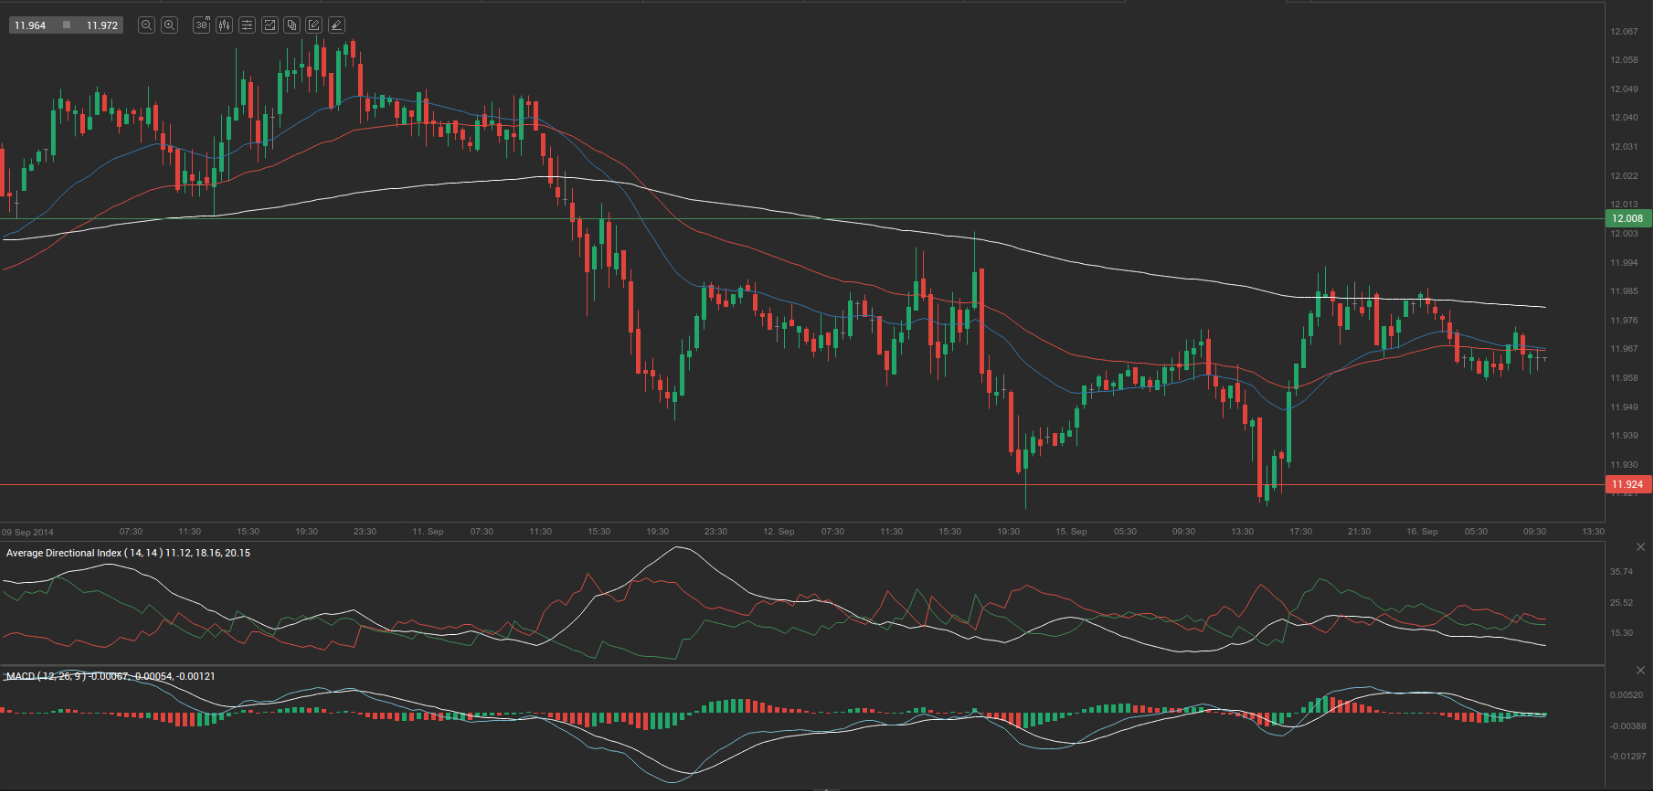
According to Binary Tribune’s daily analysis, the central pivot point for the pair is at 11.9603. In case CAD/MXN manages to breach the first resistance level at 12.0080, it will probably continue up to test 12.0441. In case the second key resistance is broken, the pair will probably attempt to advance to 12.0918.

If CAD/MXN manages to breach the first key support at 11.9242, it will probably continue to slide and test 11.8765. With this second key support broken, the movement to the downside will probably continue to 11.8404.

The mid-Pivot levels for today are as follows: M1 – 11.8585, M2 – 11.9004, M3 – 11.9423, M4 – 11.9842, M5 – 12.0261, M6 – 12.0680.

In weekly terms, the central pivot point is at 11.9767. The three key resistance levels are as follows: R1 – 12.0398, R2 – 12.1324, R3 – 12.1955. The three key support levels are: S1 – 11.8841, S2 – 11.8210, S3 – 11.7284.

TradingPedia.com is a financial media specialized in providing daily news and education covering Forex, equities and commodities. Our academies for traders cover Forex, Price Action and Social Trading.

Related News

  • Oil rises as pipeline commissioning offsets bearish EIA reportOil rises as pipeline commissioning offsets bearish EIA report Both WTI and Brent benchmarks surged on Wednesday and erased daily losses after TransCanada said that it expects to finish construction of a pipeline that will reduce stockpiles at Cushing, Oklahoma. The news offset a bearish weekly report by […]
  • Market Briefing on Thursday June 23rdMarket Briefing on Thursday June 23rd In early European trade GBP/USD reached highs unseen since December 24th 2015, rising to an intraday high of 1.4947, as an online poll by the Populus market research company revealed that 55% of the total 4 700 respondents voted in favor of […]
  • US stocks surge as investors wait for Bernanke to set directionUS stocks surge as investors wait for Bernanke to set direction US stocks map was all green yesterday with the S&P 500 offset last week decline. Investors still wait for more clarity on the subject of reducing bond purchasing program. It is expected from Fed’s Chairman, Ben Bernanke, to make a […]
  • USD/JPY maintains ground above 100.00 due to trimmed safe haven demandUSD/JPY maintains ground above 100.00 due to trimmed safe haven demand USD/JPY continued trading above 100.00 on Friday, as expectations that monetary stimulus programs in the United States, Europe and Japan will remain in place dampened demand for safe haven assets such as the Japanese yen.USD/JPY reached a […]
  • USD/ZAR: Rand pulls back from 1-month low ahead of SA manufacturing dataUSD/ZAR: Rand pulls back from 1-month low ahead of SA manufacturing data Key pointsUSD/ZAR pulls back from Friday's 1-month high South Africa manufacturing and mining data for May awaited for clues over economyThe South African Rand extended a pullback from last week's 1-month low on […]
  • Forex Market: EUR/USD daily trading outlookForex Market: EUR/USD daily trading outlook Yesterday’s trade saw EUR/USD within the range of 1.0817-1.0876. The pair closed at 1.0862, going up 0.12% on a daily basis. It has been the 7th gain in the past 17 trading days and also a second consecutive one. The daily high was a […]