Friday’s trade saw USD/RUB within the range of 37.498-37.970. The pair closed at 37.800, gaining 0.63% on a daily basis.
At 7:14 GMT today USD/RUB was up 0.48% for the day to trade at 37.982. The pair broke the first key daily resistance and touched a record high at 38.037 at 6:20 GMT.
Fundamental view
United States
New York Manufacturing Index
The New York Empire State Manufacturing Index probably climbed to a reading of 15.0 in September, according to the median estimate by experts, from 14.7 in the prior month, after reaching as high as 25.6 in July.
The index is based on the monthly Empire State Manufacturing Survey, which is conducted by the Federal Reserve Bank of New York. About 200 top manufacturing executives respond to a questionnaire, sent out during the first day of the month. They provide their estimates in regard to the performance of several business indicators from the prior month, while also forecasting performance during the upcoming six months. The ”general business conditions” component of the index is based on a distinct question, posed on the Empire State Manufacturing Survey, thus, it is not a weighted average of the other indicators. These indicators, which are only applicable to the manufacturing facilities of survey respondents in the region of New York, include new orders, shipments, unfilled orders, delivery time, inventories, prices paid, prices received, number of employees including contract workers, average employee work week, technology spending and capital expenditures.
The general business conditions component and the sub-indexes for the 11 indicators are calculated by subtracting the percentage of respondents, rating an indicator as ”lower” (a drop), from the percentage of respondents, rating the same indicator as ”higher” (an increase). In case 33% of survey respondents stated that business conditions had improved during the current month, 50% stated that conditions had not changed, and 17% of the respondents stated that conditions had deteriorated, the index would have a reading of 16. Readings above 0.00 are indicative of improving business conditions in the region. Higher than anticipated readings would certainly increase demand for the US dollar. The Federal Reserve Bank of New York is expected to release the official results from its survey at 12:30 GMT.
Industrial Production and Capacity Utilization Rate
Industrial output in the United States probably expanded 0.3% in August compared to July, following another 0.4% gain in July compared to June. In July production of auto parts and motor vehicles expanded 10.1%. In annual terms, overall production rose 5% in July, marking a seventh consecutive period of gains.
The index of industrial production reflects the change in overall inflation-adjusted value of output in sectors such as manufacturing, mining and utilities in the United States. The index is sensitive to consumer demand and interest rates. As such, industrial production is an important tool for future GDP and economic performance forecasts. Those figures are also used to measure inflation by central banks as very high levels of industrial production may lead to uncontrolled levels of consumption and rapid inflation. It is a coincident indicator, which means that changes in its levels generally echo similar shifts in overall economic activity. Any increase in the index usually boosts demand for the US dollar.
The Board of Governors of the Federal Reserve is to release the production data at 13:15 GMT.
In addition, Capacity Utilization Rate in the country probably increased to 79.3% in August from 79.2% in July. If so, this would be the highest level since March. This indicator represents the optimal rate for a stable production process, or the highest possible level of production in an enterprise, in case it operates within a realistic work schedule and has sufficient raw materials and inventories at its disposal. High rates of capacity utilization usually lead to inflationary pressure. In general, higher rates tend to be dollar positive.
Russian Federation
New sanctions
On Friday USD/RUB touched a daily high level of 37.970, after the European Union introduced new sanctions against the Russian Federation, while Kremlin may respond with counter-sanctions. It is possible, that Russia may even prohibit import of items, such as clothing and used automobiles. The country may also impose restrictions on commercial flights through its airspace towards the Asian Pacific region. On Friday the EU imposed sanctions on 15 other companies, including OAO Gazprom, OAO Rosneft, OAO Transneft, and 24 other individuals.
Russian Industrial Production
Annualized industrial production in Russia probably increased 1.2% in August, according to the median forecast by experts, after a 1.5% increase in July. The index reflects the change in overall inflation-adjusted value of output in sectors such as manufacturing, mining and utilities. In case industrial output expanded less than anticipated, this would have a bearish effect on the ruble. The official report is to be released at 12:00 GMT by the Federal State Statistics Service.
Technical view
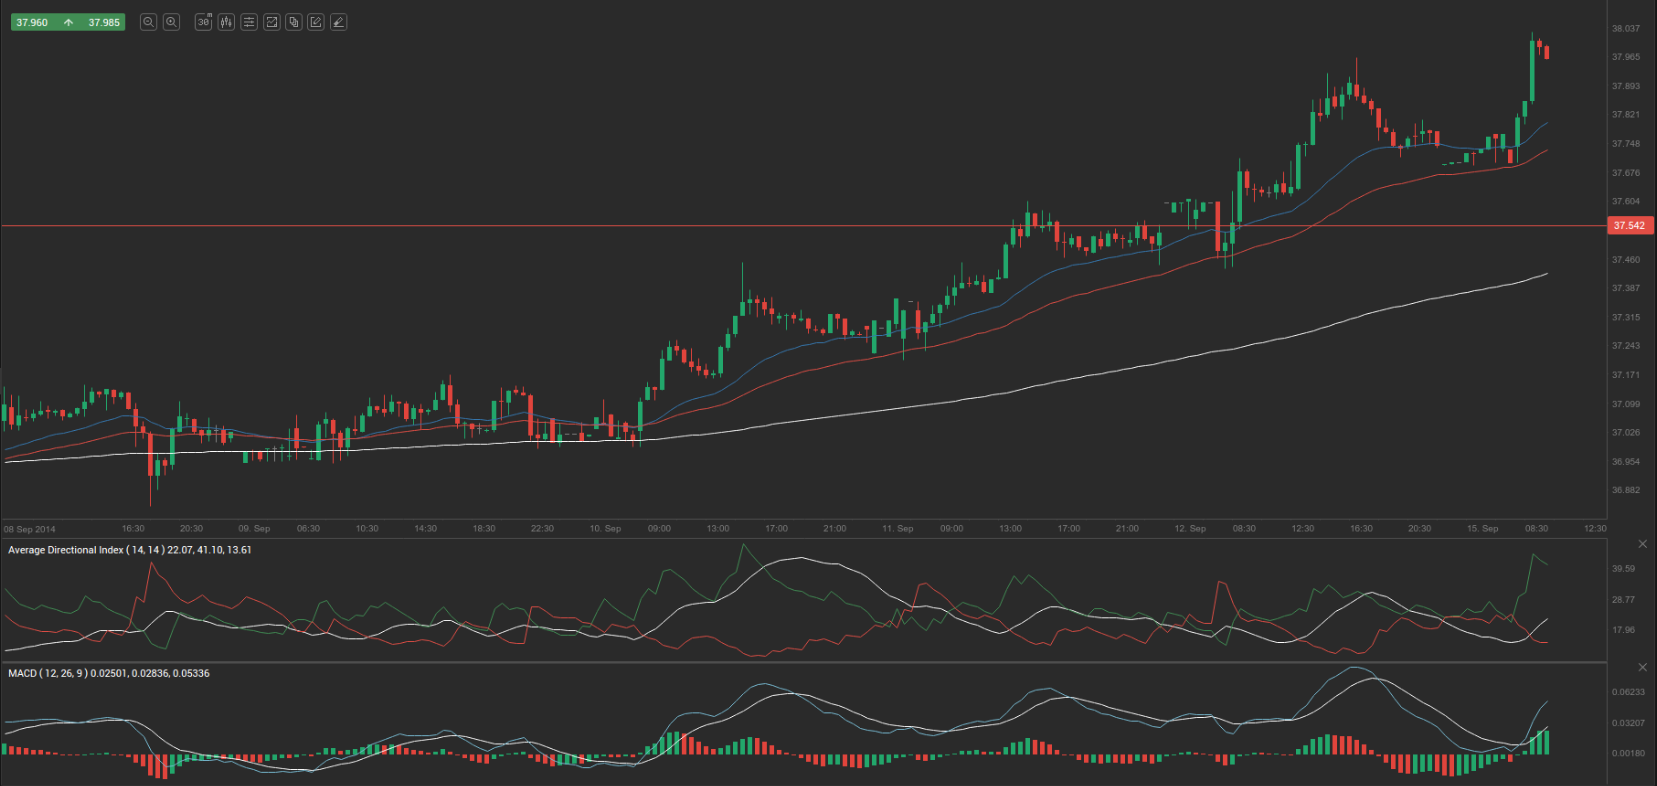
According to Binary Tribune’s daily analysis, the central pivot point for the pair is at 37.756. In case USD/RUB manages to breach the first resistance level at 38.014, it will probably continue up to test 38.228. In case the second key resistance is broken, the pair will probably attempt to advance to 38.486.
If USD/RUB manages to breach the first key support at 37.542, it will probably continue to slide and test 37.284. With this second key support broken, the movement to the downside will probably continue to 37.070.
The mid-Pivot levels for today are as follows: M1 – 37.177, M2 – 37.413, M3 – 37.649, M4 – 37.885, M5 – 38.121, M6 – 38.357.
In weekly terms, the central pivot point is at 37.541. The three key resistance levels are as follows: R1 – 38.229, R2 – 38.658, R3 – 39.346. The three key support levels are: S1 – 37.112, S2 – 36.424, S3 – 35.995.