Friday’s trade saw USD/BGN within the range of 1.5067-1.5148. The pair closed at 1.5088, losing 0.30% on a daily basis.
At 6:58 GMT today USD/BGN was down 0.01% for the day to trade at 1.5096. The pair touched a daily low at 1.5080 at 3:40 GMT.
Fundamental view
United States
New York Manufacturing Index
The New York Empire State Manufacturing Index probably climbed to a reading of 15.0 in September, according to the median estimate by experts, from 14.7 in the prior month, after reaching as high as 25.6 in July.
The index is based on the monthly Empire State Manufacturing Survey, which is conducted by the Federal Reserve Bank of New York. About 200 top manufacturing executives respond to a questionnaire, sent out during the first day of the month. They provide their estimates in regard to the performance of several business indicators from the prior month, while also forecasting performance during the upcoming six months. The ”general business conditions” component of the index is based on a distinct question, posed on the Empire State Manufacturing Survey, thus, it is not a weighted average of the other indicators. These indicators, which are only applicable to the manufacturing facilities of survey respondents in the region of New York, include new orders, shipments, unfilled orders, delivery time, inventories, prices paid, prices received, number of employees including contract workers, average employee work week, technology spending and capital expenditures.
The general business conditions component and the sub-indexes for the 11 indicators are calculated by subtracting the percentage of respondents, rating an indicator as ”lower” (a drop), from the percentage of respondents, rating the same indicator as ”higher” (an increase). In case 33% of survey respondents stated that business conditions had improved during the current month, 50% stated that conditions had not changed, and 17% of the respondents stated that conditions had deteriorated, the index would have a reading of 16. Readings above 0.00 are indicative of improving business conditions in the region. Higher than anticipated readings would certainly increase demand for the US dollar. The Federal Reserve Bank of New York is expected to release the official results from its survey at 12:30 GMT.
Industrial Production and Capacity Utilization Rate
Industrial output in the United States probably expanded 0.3% in August compared to July, following another 0.4% gain in July compared to June. In July production of auto parts and motor vehicles expanded 10.1%. In annual terms, overall production rose 5% in July, marking a seventh consecutive period of gains.
The index of industrial production reflects the change in overall inflation-adjusted value of output in sectors such as manufacturing, mining and utilities in the United States. The index is sensitive to consumer demand and interest rates. As such, industrial production is an important tool for future GDP and economic performance forecasts. Those figures are also used to measure inflation by central banks as very high levels of industrial production may lead to uncontrolled levels of consumption and rapid inflation. It is a coincident indicator, which means that changes in its levels generally echo similar shifts in overall economic activity. Any increase in the index usually boosts demand for the US dollar.
The Board of Governors of the Federal Reserve is to release the production data at 13:15 GMT.
In addition, Capacity Utilization Rate in the country probably increased to 79.3% in August from 79.2% in July. If so, this would be the highest level since March. This indicator represents the optimal rate for a stable production process, or the highest possible level of production in an enterprise, in case it operates within a realistic work schedule and has sufficient raw materials and inventories at its disposal. High rates of capacity utilization usually lead to inflationary pressure. In general, higher rates tend to be dollar positive.
Bulgaria
Consumer Inflation
Bulgarian annualized index of consumer prices (CPI) probably continued to improve, reaching -0.5% in August, from -1.0% in July. If so, this would be the highest level since August 2013, when consumer inflation was reported at -0.7%. Nations CPI hit an all-time low at -2.60% in February this year. The index measures the change in price levels of a basket of goods and services from consumer’s perspective and also reflects purchasing trends. In case consumer inflation slowed down less than anticipated, this would provide support to the lev. The National Statistical Institute is to release the official CPI report at 8:00 GMT.
Current Account
The surplus on nations current account probably shrank to 221.6 million EUR in July from 450.4 million EUR in June, as the latter has been the largest surplus since the record high figure, recorded in August 2013 (852.1 million EUR).
The current account reflects the difference between a nation’s savings and its investments. It is the sum of the balance of trade, net current transfers (cash transfers) and net income from abroad (earnings from investments made abroad plus money sent by individuals working abroad to their families back home, minus payments made to foreign investors).
A current account surplus indicates that a country’s net foreign assets have increased by the respective amount, while a deficit suggests the opposite. A country with a surplus on its current account is considered as a net lender to the rest of the world, while a current account deficit puts it in the position of a net borrower. A net lender is consuming less than it is producing, which means it is saving and those savings are being invested abroad, or foreign assets are created. A net borrower is consuming more than it is producing, which means that other countries are lending it their savings, or foreign liabilities are created. Therefore, a contracting surplus or a widening deficit on the current account of a nation usually has a bearish effect on its currency.
The Bulgarian National Bank is expected to release the official data at 9:00 GMT.
Technical view
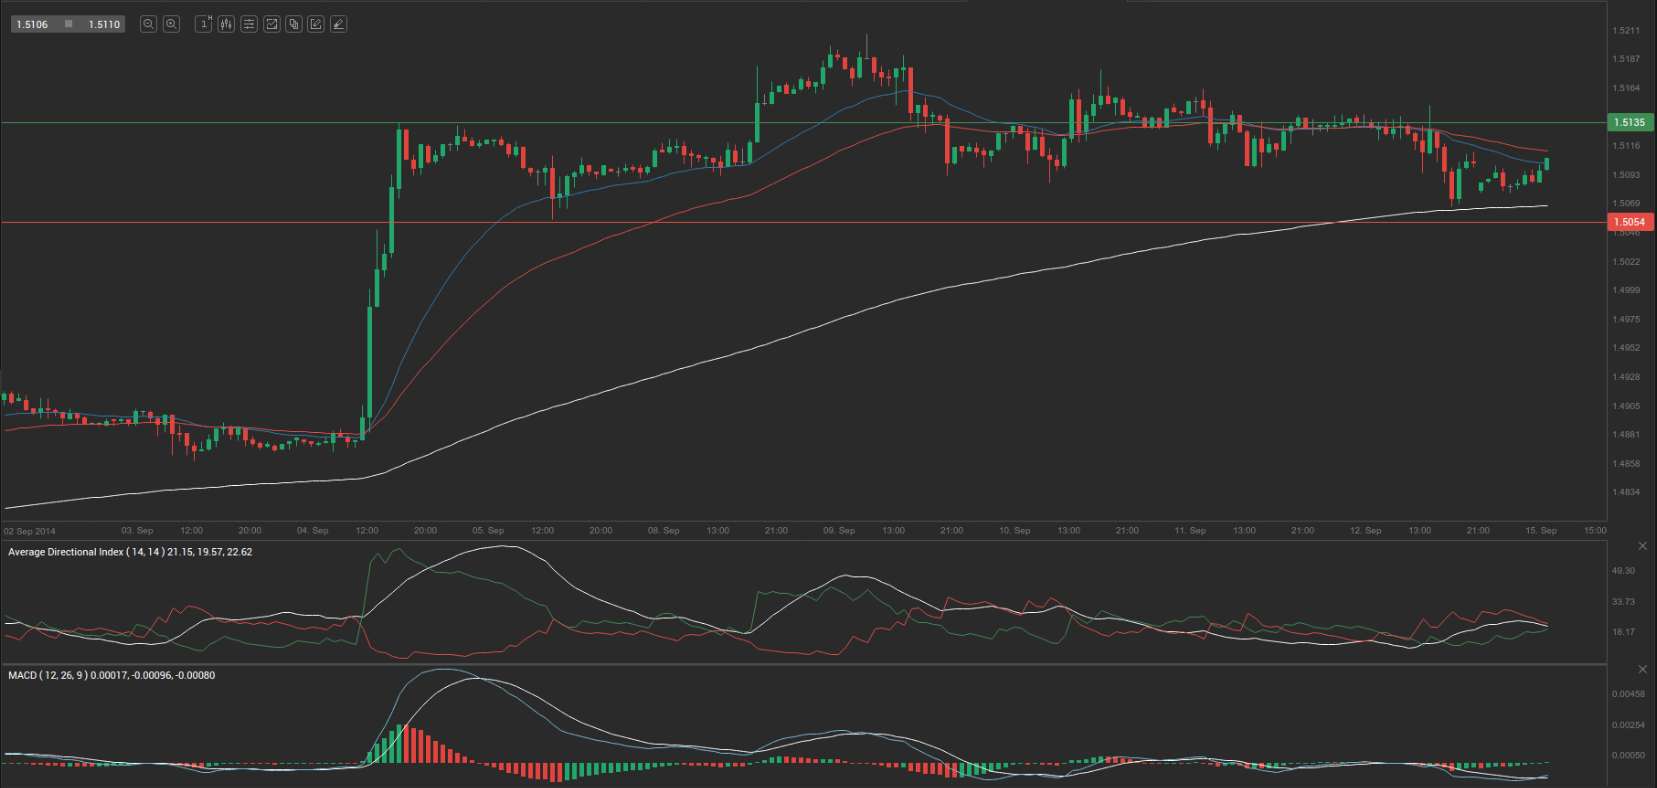
According to Binary Tribune’s daily analysis, the central pivot point for the pair is at 1.5101. In case USD/BGN manages to breach the first resistance level at 1.5135, it will probably continue up to test 1.5182. In case the second key resistance is broken, the pair will probably attempt to advance to 1.5216.
If USD/BGN manages to breach the first key support at 1.5054, it will probably continue to slide and test 1.5020. With this second key support broken, the movement to the downside will probably continue to 1.4973.
The mid-Pivot levels for today are as follows: M1 – 1.4997, M2 – 1.5037, M3 – 1.5078, M4 – 1.5118, M5 – 1.5159, M6 – 1.5199.
In weekly terms, the central pivot point is at 1.5122. The three key resistance levels are as follows: R1 – 1.5176, R2 – 1.5265, R3 – 1.5319. The three key support levels are: S1 – 1.5033, S2 – 1.4979, S3 – 1.4890.