Key Moments
- Litecoin (LTC) traded at $70.34 in the early October 5 UTC session, holding above all major daily moving averages from the SMA 7 at $69.06 to the SMA 200 at $51.45.
- Price has been confined to a narrow $69.59-$72.30 intraday range with -0.04% net daily change, as spot volume on Binance reached $21.5 million and momentum gauges such as MACD and RSI signaled indecision.
- Binance futures “top traders” are 71.4% net long with a 2.50 long/short ratio, while key technical levels remain set at $71.90 and $73.45 on the upside and $69.19 and $68.03 on the downside.
The $70 Congestion Zone: Strong Trend, Quiet Tape
Litecoin has staged a meaningful advance, with LTC changing hands at $70.34 in the early October 5 UTC session. On the daily chart, the token is positioned above a full stack of moving averages, starting with the short-term SMA 7 at $69.06 and extending down to the longer-term SMA 200 at $51.45. This alignment reflects a broadly positive, multi-timeframe trend that has developed over months, signaling steady accumulation at lower price levels and a higher overall valuation framework for LTC.
Despite that constructive backdrop, the latest price action has shifted into a tight holding pattern. Over the most recent 24-hour window, LTC has fluctuated within a narrow band from $69.59 to $72.30, with a net daily move of -0.04%. This compressed range, combined with Binance spot trading volume of $21.5 million, points to a market where activity has slowed and neither buyers nor sellers are pressing aggressively. The current setup resembles a compressed coil in an established trend, typically a precursor to a sharp directional move once a catalyst emerges.
Momentum Gauges Signal a Standstill at Elevated Levels
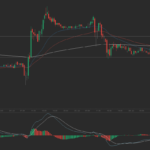
While the moving average configuration appears decisively bullish, momentum indicators paint a more cautious picture. The MACD histogram is printing at exactly 0.0000, reflecting a perfect convergence of the MACD and signal lines. This does not in itself imply negative momentum, but it does indicate a complete absence of directional drive. In trending environments, such momentum vacuums frequently resolve with force, and the next shift in the histogram often influences the tone for the subsequent week.
The RSI reading of 69.08 adds to the tension. Traditional overbought conditions are typically defined at 70, placing LTC just below that threshold. Market participants who entered late in the rally are likely mapping out exit points, creating potential overhead supply even when underlying demand is intact. The Stochastic %K at 71.23 is notably ahead of the %D at 56.99, implying that near-term momentum still leans bullish, although the convergence of those lines will be an important signal to monitor.
Bollinger Bands further contextualize the setup. With a placement value of 0.69, LTC is trading in the upper half of its volatility envelope, and the upper band sits at $78.10, leaving room for an upside extension if a breakout develops. At the same time, the current stalemate shows that the market has yet to commit to that move.
Key Technical Levels and Volatility Profile
The current trading map for LTC is defined by a small cluster of critical levels. On the upside, $71.90 stands out as immediate resistance that bulls must overcome convincingly. A subsequent barrier awaits at $73.45, viewed as a more significant structural test for the ongoing uptrend.
Support zones are equally well defined. The first notable level lies at $69.19, while a more substantial floor is identified at $68.03, where institutional demand is expected to play a stronger role. With a daily Average True Range (ATR) of $4.02, a full move from near-term support to resistance can unfold within a single session, underscoring that LTC is not in a low-volatility regime despite the recent compression.
| Metric | Value |
|---|---|
| Current price (early October 5 UTC) | $70.34 |
| Daily range | $69.59 – $72.30 |
| Net daily change | -0.04% |
| Binance spot volume | $21.5 million |
| SMA 7 | $69.06 |
| SMA 20 | $65.44 |
| SMA 200 | $51.45 |
| RSI | 69.08 |
| Stochastic %K / %D | 71.23 / 56.99 |
| Bollinger Band placement | 0.69 |
| Upper Bollinger Band | $78.10 |
| Immediate resistance | $71.90 |
| Key resistance | $73.45 |
| First support | $69.19 |
| Major support | $68.03 |
| Daily ATR | $4.02 |
Derivatives Positioning: Smart Money and Retail Lean the Same Way
Futures market data adds an important dimension to the current Litecoin narrative. On Binance, the group labeled as top traders is expressing a strong bullish tilt, with a 2.50 long/short ratio and 71.4% of their exposure positioned on the long side. Retail traders show a similar directional preference, with 67.5% of positions long and an overall long/short ratio of 2.08.
When professional and retail cohorts are both skewed in the same direction, the market sits at a decision point: either the consensus is correct and the trend extends, or positioning sets the stage for a sharp move against the crowd. The funding rate of -0.0001% helps clarify the picture. This near-flat reading indicates that long positions are not incurring a significant cost to remain open, suggesting that bullish exposure has not yet reached a level typically associated with crowded, unstable trades. A markedly higher positive funding rate, such as +0.05% or above, would have implied a more stretched configuration, which is not the case here.
Order flow metrics offer modest confirmation of an underlying bid. The taker buy/sell ratio sits at 1.09, indicating that market buy orders are slightly outpacing market sells, and buyers are absorbing available supply rather than retreating. However, open interest stands at $102 million and has slipped by 0.31% over the past 24 hours. This small decline in open interest during a period of sideways price action illustrates that some long exposure is being trimmed, reflecting prudence rather than aggressive accumulation ahead of a potential breakout.
 TradingPedia.com is a financial media specialized in providing daily news and education covering Forex, equities and commodities. Our academies for traders cover