Key Moments
- Solana (SOL) is trading above $111.70 on Monday after advancing nearly 12% over the prior week.
- Tokenized equities on Solana have reached an all-time high of 850,000 unique on-chain holders, according to the project’s official X post.
- Solana spot ETFs posted $13.19 million in weekly inflows, extending a streak of 12 consecutive weeks of net inflows.
On-Chain Equity Participation Reaches Record High
Solana (SOL) is extending its recent rally, changing hands around $111.74 on Monday after gaining nearly 12% last week. The latest leg higher is unfolding alongside fresh growth in Solana’s tokenized equity segment, which has reached a new participation record.
In an announcement on its official X account on Sunday, Solana reported that tokenized equities on the network have achieved an all-time high of 850,000 unique on-chain holders. This expansion in tokenized asset ownership underscores rising engagement on the blockchain and ongoing confidence in the ecosystem, a backdrop that could prove supportive for SOL over the longer term.
Institutional Flows into Solana ETFs Strengthen
Institutional interest in Solana continues to build. Data from SoSoValue showed that Solana Exchange-Traded Funds (ETFs) attracted $13.19 million in net inflows over the last week. These products have now logged 12 consecutive weeks of net inflows since early July.
If this pattern of inflows persists or accelerates in the coming week, it may provide additional fuel for the ongoing move higher in SOL.
| Metric | Latest Observation |
|---|---|
| SOL price (Monday) | $111.74 |
| Weekly SOL price performance | Nearly 12% gain |
| Tokenized equity unique on-chain holders (ATH) | 850,000 |
| Weekly SOL ETF net inflows | $13.19 million |
| Consecutive weeks of SOL ETF inflows | 12 |
Technical Picture: Uptrend Intact Above Key Moving Averages
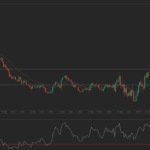
From a technical standpoint, Solana is maintaining a constructive bullish tone as it trades well above its 50-day, 100-day, and 200-day exponential moving averages (EMAs). The uptrend support line that has been directing the advance has recently been tested near current levels, and a solid close above recent highs is preserving the broader positive structure.
Momentum gauges are aligned with this bias. The Relative Strength Index (RSI) is holding in the mid-60s, while the Moving Average Convergence Divergence (MACD) line remains above the signal line in positive territory, indicating that buyers still have the upper hand in the near term.
Key Support and Resistance Levels
On the downside, initial support appears to be developing around the immediate pivot area near $111. A more meaningful retreat would bring the horizontal support zone and the 50-day EMA, both positioned just below $96, into focus. Below that, the 200-day EMA sits near $93, with the 100-day EMA located closer to $90. A deeper correction could see price action revisit a broader structural base in the vicinity of $77.
On the upside, bullish participants are watching the $120 level. A daily close above that threshold would signal scope for additional upside.
Chart Context
The current move is unfolding on the SOL/USDT daily chart, where the prevailing trend, the alignment of EMAs, and firm momentum indicators collectively suggest that higher highs remain possible as long as the key support areas continue to hold.
 TradingPedia.com is a financial media specialized in providing daily news and education covering Forex, equities and commodities. Our academies for traders cover