Key moments
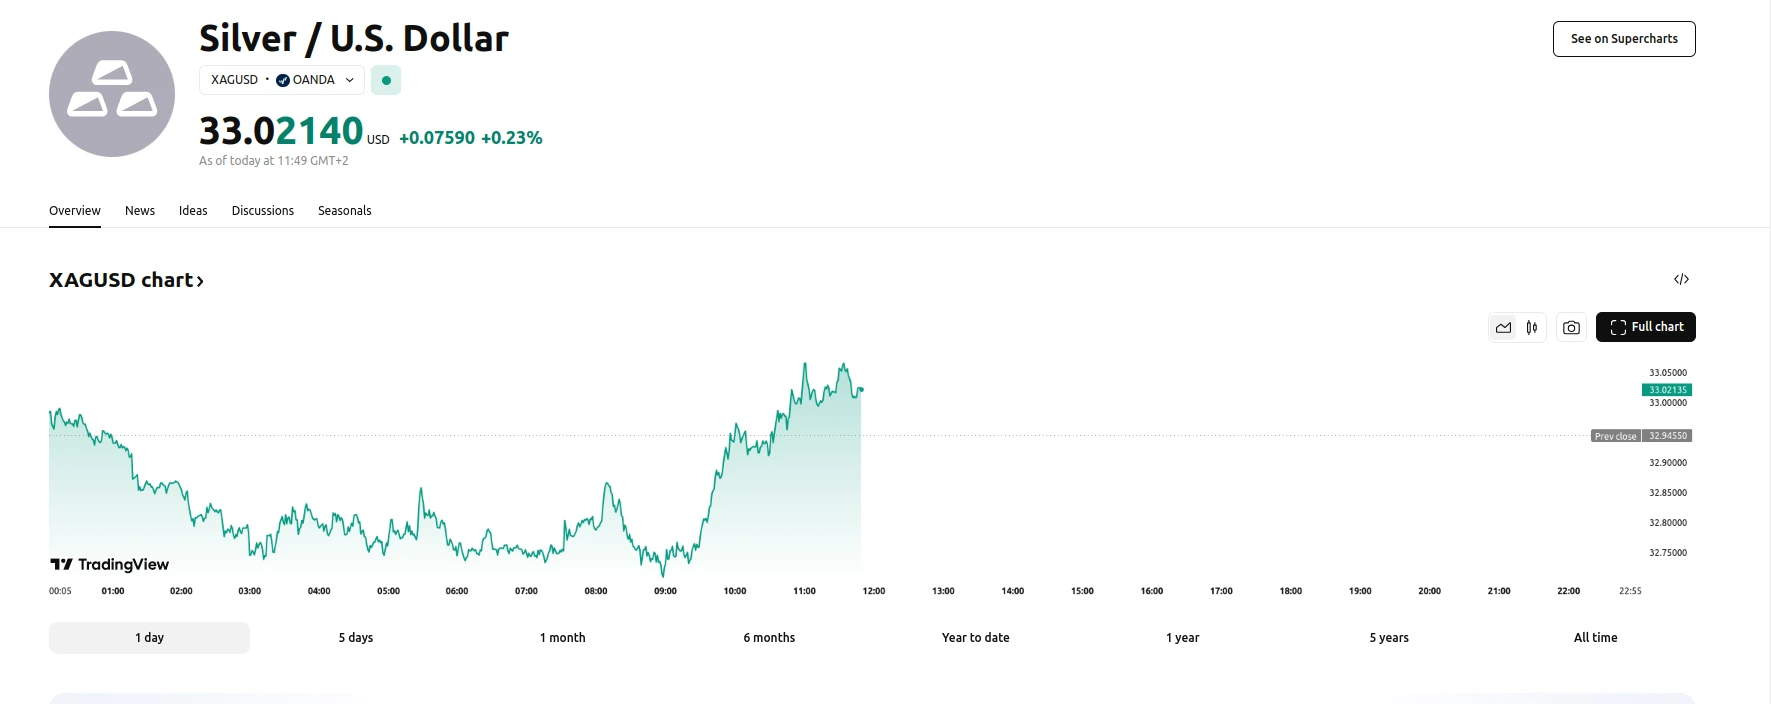
- Silver price (XAG/USD) trades near $33.00, fluctuating after recent gains.
- Technical indicators suggest a weakening bullish bias, yet short-term momentum remains positive.
- Key resistance identified at the four-month high of $33.40, with support at $32.41.
Key Levels: $33.40 Resistance, $32.41 Support, Bullish RSI Above 50
The silver price (XAG/USD) is experiencing a period of fluctuation, hovering around the $33.00 mark during Wednesday’s Asian trading hours. This movement follows gains recorded in the preceding session. Technical analysis of the daily chart indicates a degree of uncertainty, with a noted weakening of the previously strong bullish bias. This observation is based on the metal’s position below an ascending channel pattern, a key element in the technical analysis.
Despite this weakening trend, certain technical indicators continue to signal positive momentum. The silver price remains above both the nine-day and 50-day Exponential Moving Averages (EMAs), suggesting that short-term upward momentum is still present. Furthermore, the 14-day Relative Strength Index (RSI) remains above the 50 level, which is generally interpreted as a confirmation of bullish sentiment.
Looking ahead, the $33.40 level, representing a four-month high reached on February 14, is identified as a key resistance point. This level also aligns with the lower boundary of the ascending channel. A successful break above this resistance could lead to further upward movement, potentially pushing the silver price towards the channel’s upper boundary at $35.10. Conversely, a decline below the nine-day EMA at $32.41 could indicate a shift in momentum, with further support found at the 50-day EMA of $31.65. A breach of this support could lead to a test of lower levels, including the two-month low of $30.70.