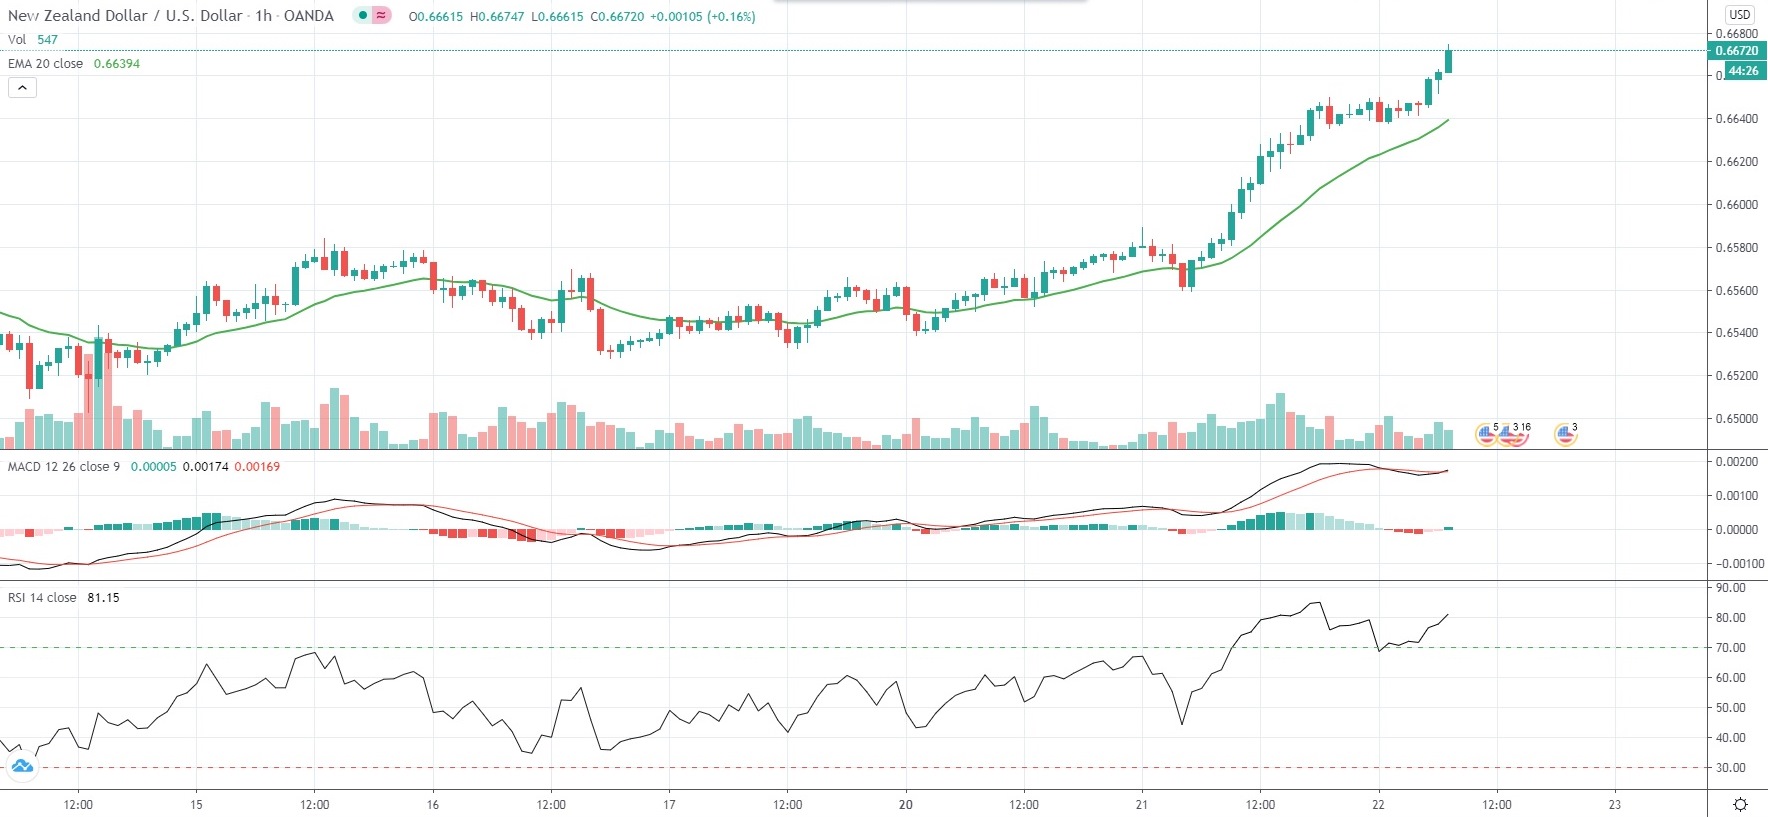
NZD/USD gained for a fourth straight trading day on Wednesday, touching highs not seen since early January, as a surge in investor risk appetite helped the pair overcome a major level of resistance (0.6600).
The announcement of a “historic” EU deal on a EUR 750 billion stimulus plan continued to support risk-on mood.
“The deal marks a significant step towards European fiscal solidarity which is positive for the European and global economic recovery,” CBA economist Kim Mundy said.
Meanwhile, the US Dollar remained broadly weaker, with additional pressure on the currency being mounted by speculation the Federal Reserve might be prompted to ease policy further amid spiking new COVID-19 cases and deaths across the US.
Yesterday Republicans and Democrats did not manage to reach consensus on the next round of coronavirus relief measures. According to House Speaker Nancy Pelosi, Republicans’ $1 trillion package may not be enough. Two months ago, the House of Representatives, led by Democrats, passed a $3 trillion relief bill, which has been ignored by the Republican-dominated Senate.
As of 7:11 GMT on Wednesday NZD/USD was gaining 0.44% to trade at 0.6671, after earlier touching an intraday high of 0.6675, or a level not seen since January 7th (0.6679). The major pair has risen 1.79% so far this week, after losing 0.28% in the prior week.
On today’s economic calendar, at 14:00 GMT the National Association of Realtors will report on US existing home sales. The respective index probably rebounded 24.7% to a seasonally adjusted annual level of 4.80 million units in June compared to May, according to market consensus. In May, sales of previously owned houses were 9.7% lower from a month ago to 3.91 million units, also the lowest level since October 2010.
Bond Yield Spread
The spread between 1-year New Zealand and 1-year US bond yields, which reflects the flow of funds in a short term, equaled 9.4 basis points (0.094%) as of 6:15 GMT on Wednesday, down from 10.6 basis points on July 21st.
Daily Pivot Levels (traditional method of calculation)
Central Pivot – 0.6617
R1 – 0.6675
R2 – 0.6707
R3 – 0.6765
R4 – 0.6823
S1 – 0.6584
S2 – 0.6527
S3 – 0.6494
S4 – 0.6461
 TradingPedia.com is a financial media specialized in providing daily news and education covering Forex, equities and commodities. Our academies for traders cover