Yesterday’s trade saw USD/JPY within the range of 119.95-121.34. The pair closed at 120.61, up 0.08% on a daily basis, or the most modest daily gain since August 18th, when it rose a mere 0.02%. Thursday has also been a fourth consecutive trading day of gains. The daily high has been the highest level since August 31st, when the cross registered a high of 121.75.
At 8:15 GMT today USD/JPY was down 0.09% for the day to trade at 120.51. The pair tested the daily S2 level, as it touched a daily low at 120.38 at 7:40 GMT.
Today the cross may be influenced by a number of macroeconomic reports as listed below.
Fundamentals
United States
Producer Prices
Annual producer prices in the United States probably fell for a seventh month in a row in August, by 0.9%, according to the median estimate by experts. In July the annualized Producer Price Index decreased 0.8%. This index reflects the change in prices of over 8 000 products, sold by manufacturers during the respective period. The Producer Price Index (PPI) differs from the Consumer Price Index (CPI), which measures the change in prices from consumer’s perspective, due to subsidies, taxes and distribution costs of different types of manufacturers in the country. The logic behind this indicator is that in case producers are forced to pay more for goods and services, they are more likely to pass these higher costs to the end consumer. Therefore, the PPI is considered as a leading indicator of consumer inflation. In case annual producer prices fell at a sharper rate than anticipated, this would usually have a moderate bearish effect on the US dollar.
The nation’s annualized core producer price inflation, which excludes prices of volatile categories such as food and energy, probably accelerated to 0.7% in August from 0.6% in the prior month. This indicator is quite sensitive to changes in aggregate demand, therefore, it can be used as a leading indicator for economy. However, because of its restrained scope, it is not suitable for future inflation forecasts. The Bureau of Labor Statistics is expected to report on the official PPI performance at 12:30 GMT.
Reuters/Michigan Consumer Sentiment Index – preliminary estimate
The monthly survey by Thomson Reuters and the University of Michigan may show that consumer confidence in the United States lowered for a third straight month in September. The preliminary reading of the corresponding index, which usually comes out two weeks ahead of the final data, probably slipped to 91.2 during the current month from a final reading of 91.9 in August. If so, this would be the lowest index reading since May 2015, when a final value of 90.7 was reported. The survey encompasses about 500 respondents throughout the country. The index is comprised by two major components, a gauge of current conditions and a gauge of expectations. The current conditions index is based on the answers to two standard questions, while the index of expectations is based on three standard questions. All five questions have an equal weight in determining the value of the overall index.
The sub-index of current economic conditions decreased to a final reading of 105.1 from a preliminary 107.1 in August, after a month ago it stood at 107.2.
The sub-index of consumer expectations came in at a reading of 83.4, down from a preliminary value of 83.8 in August and also down from a final reading of 84.1, registered in July. Augusts final reading has been the lowest one since November 2014.
Participants in the August survey expect that the rate of inflation will be 2.8% during the next year, or unchanged compared to the preliminary reading and the reading expected in July.
In case the gauge of consumer sentiment fell at a steeper pace than projected in September, this would have a moderate bearish effect on the greenback. The preliminary reading is due out at 14:00 GMT.
Bond Yield Spread
The yield on Japanese 2-year government bonds went as high as 0.019% on September 10th, or matching the high from the previous trading day, after which it slid to 0.015% at the close to remain unchanged on a daily basis.
The yield on US 2-year government bonds climbed as high as 0.749% on September 10th, after which it fell to 0.737% at the close to lose 0.004 percentage point for the day. It has been the first drop in the past five trading days.
The spread between 2-year US and 2-year Japanese bond yields, which reflects the flow of funds in a short term, shrank to 0.722% on September 10th from 0.726% during the prior day. The September 10th yield spread has been the lowest one since September 7th, when the difference was 0.702%.
Meanwhile, the yield on Japans 10-year government bonds soared as high as 0.367% on September 10th, after which it closed at the exact same level to appreciate 0.006 percentage point compared to September 9th.
The yield on US 10-year government bonds climbed as high as 2.236% on September 10th, after which it slipped to 2.227% at the close to add 3.2 basis points (0.032 percentage point) on a daily basis. It has been the fourth successive trading day of gains.
The spread between 10-year US and 10-year Japanese bond yields expanded to 1.860% on September 10th from 1.834% during the prior day. The September 10th yield difference has been the largest one since August 5th, when the spread was 1.872%.
Daily and Weekly Pivot Levels
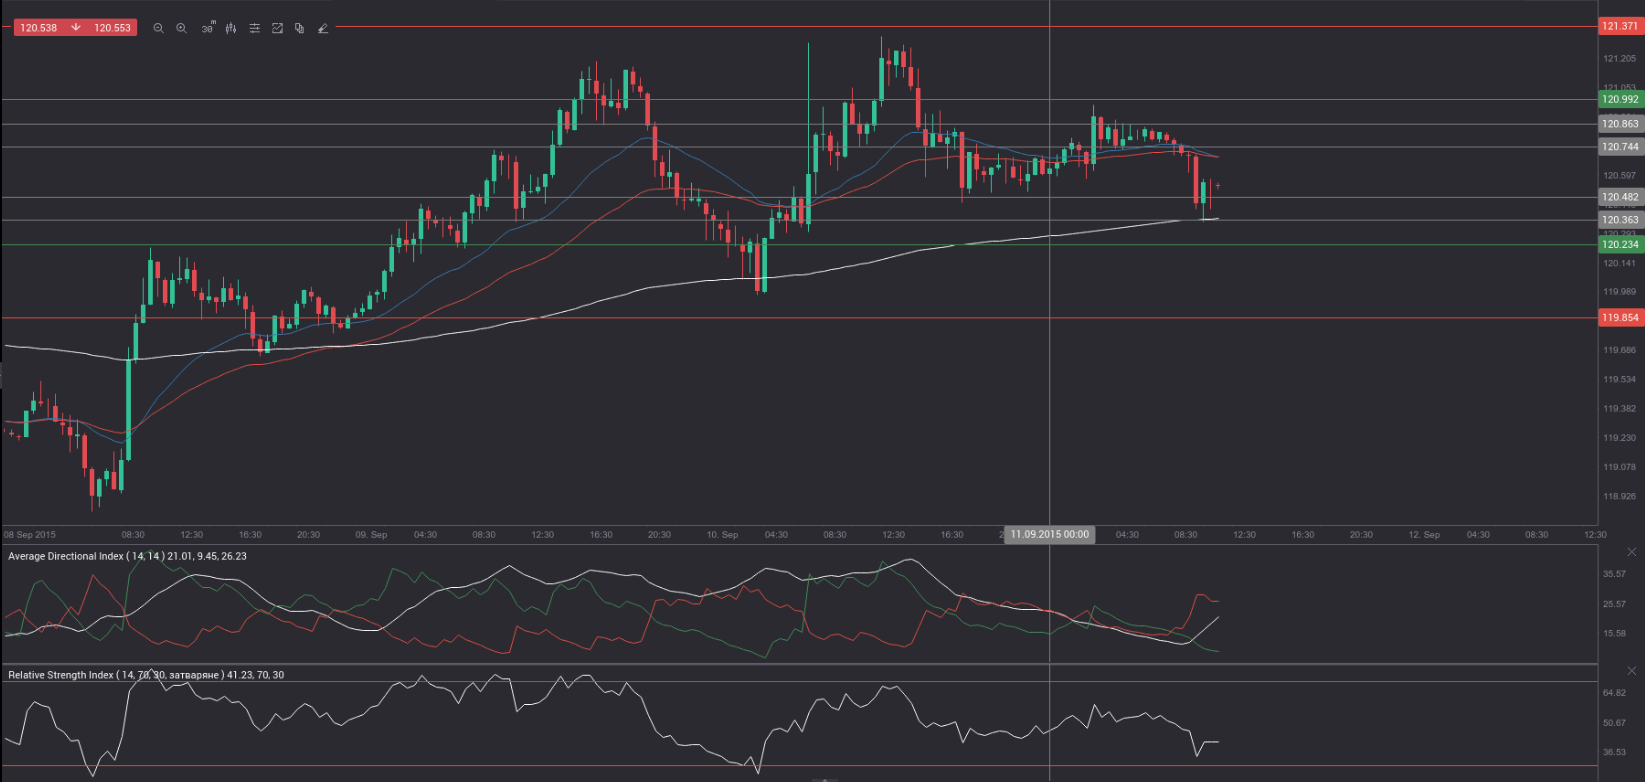
By employing the Camarilla calculation method, the daily pivot levels for USD/JPY are presented as follows:
R1 – 120.74
R2 – 120.86
R3 (range resistance – green on the 30-minute chart) – 120.99
R4 (range breakout – red on the 30-minute chart) – 121.37
S1 – 120.48
S2 – 120.36
S3 (range support – green on the 30-minute chart) – 120.23
S4 (range breakout – red on the 30-minute chart) – 119.85
By using the traditional method of calculation, the weekly pivot levels for USD/JPY are presented as follows:
Central Pivot Point – 119.83
R1 – 120.92
R2 – 122.83
R3 – 123.92
S1 – 117.92
S2 – 116.83
S3 – 114.92