Yesterday’s trade saw USD/JPY within the range of 119.20-120.47. The pair closed at 120.33, soaring 0.80% on a daily basis, or the most considerable daily gain since August 27th, when it appreciated 0.93%. The daily low has been the lowest level since August 26th, when the cross registered a low of 118.43.
At 7:16 GMT today USD/JPY was down 0.05% for the day to trade at 120.27. The pair tested the daily S1 level, as it touched a daily low at 120.22 at 7:05 GMT.
Today the cross may be influenced by a number of macroeconomic reports as listed below.
Fundamentals
United States
Initial, Continuing Jobless Claims
The number of people in the United States, who filed for unemployment assistance for the first time during the business week ended on August 28th, probably rose to 275 000, according to market expectations, from 271 000 in the prior week. The latter has been the lowest number of claims since the business week ended on July 31st, when 270 000 claims were reported.
The 4-week moving average, an indicator lacking seasonal effects, was 272 500, marking an increase of 1 000 compared to the preceding weeks unrevised average.
The business week, which ended on August 21st has been the 25th consecutive week, when jobless claims stood below the 300 000 threshold. This continues to support the case labor market conditions in the country follow the path of improvement. Claims are usually volatile during the summer period, as automakers shut assembly plants for annual retooling and also due to school vacations.
Initial jobless claims number is a short-term indicator, reflecting lay-offs in the country. In case the number of claims met expectations or increased further, this would have a moderate bearish effect on the US dollar.
The number of continuing jobless claims probably decreased to the seasonally adjusted 2 250 000 during the business week ended on August 21st from 2 269 000 in the prior week. The latter represented an increase by 13 000 compared to the revised up number of claims, reported in the business week ended on August 7th. This indicator reflects the actual number of people unemployed and currently receiving unemployment benefits, who filed for unemployment assistance at least two weeks ago.
The Department of Labor is to release the weekly report at 12:30 GMT.
Balance of Trade
The deficit on US balance of trade probably narrowed to USD 42.40 billion in July from a trade gap of USD 43.84 billion, registered in June. Total exports were little changed at USD 188.6 billion in June, suppressed by the strong dollar, from USD 188.7 billion in May. Exports of goods shrank USD 0.2 billion to reach USD 127.6 billion in June, those of capital goods went down by USD 0.8 billion, while exports of telecommunications equipment fell USD 0.3 billion. Exports of consumer goods, on the other hand, went up USD 0.8 billion.
Total imports were up 1.2% to USD 232.4 billion in June. Imports of food and automobiles reached their highest level on record. Imports of goods went up by USD 2.7 billion to USD 191.1 billion.
US exports to the European Union shrank 2.3% in June, while imports from the EU rose 4% to a record high, which resulted in the highest trade deficit with the EU on record.
In case the trade gap narrowed more than projected in July, this would strongly support the US dollar, as it implies a positive contribution to the nations Gross Domestic Product. The Bureau of Economic Analysis will release the official trade data at 12:30 GMT.
Non-manufacturing PMI by the ISM
Activity in United States’ sector of services probably slowed down in August, with the corresponding non-manufacturing PMI coming in at a reading of 58.1, according to expectations, down from 60.3 in July. The latter has been the highest PMI level since June 2007, when the indicator was reported at 60.7. If expectations were met, August would be the 68th consecutive month, when the gauge stood in the area above 50.0. This is a compound index, based on the values of four equally-weighted components, which comprise it. These sub-indexes reflect seasonally adjusted new orders, seasonally adjusted employment, seasonally adjusted business activity and supplier deliveries.
The business report is based on data compiled from monthly replies to questions asked of over 370 purchasing and supply executives operating in over 62 different industries, which represent nine divisions from the Standard Industrial Classification (SIC) categories.
Participants can either respond with “better”, “same”, or “worse” to the questions about the industry, in which they operate. The resulting PMI value is measured from 0 to 100. If the index shows a value of 100.0, this means that 100% of the respondents reported an improvement in conditions. If the index shows a value of 0, this means that 100% or the respondents reported a deterioration in conditions. If 100% of the respondents saw no change in conditions, the index will show a reading of 50.0. Therefore, readings above the key level of 50.0 are indicative of optimism (expansion in activity). In case, however, the index slowed down at a larger rate than anticipated, this would lead to a heavy sell-off of the US dollar. The Institute for Supply Management (ISM) is to release the official PMI reading at 14:00 GMT.
Bond Yield Spread
The yield on Japanese 2-year government bonds went as high as 0.016% on September 2nd, or matching the high from the previous trading day, after which it slid to 0.015% at the close to add 0.004 percentage point on a daily basis. It has been the first gain in the past four trading days.
The yield on US 2-year government bonds climbed as high as 0.728% on September 2nd, after which it fell to 0.708% at the close to lose 0.004 percentage point for the day, while marking a second straight daily drop.
The spread between 2-year US and 2-year Japanese bond yields, which reflects the flow of funds in a short term, shrank to 0.693% on September 2nd from 0.701% during the prior day. The September 2nd yield spread has been the lowest one since August 27th, when the difference was 0.688%.
Meanwhile, the yield on Japans 10-year government bonds soared as high as 0.400% on September 2nd, after which it slid to 0.396% at the close to appreciate 2.7 basis points (0.027 percentage point) compared to September 1st, while marking the first gain in the past four trading days.
The yield on US 10-year government bonds climbed as high as 2.198% on September 2nd, after which it slipped to 2.179% at the close to add 2 basis points (0.02 percentage point) on a daily basis.
The spread between 10-year US and 10-year Japanese bond yields narrowed to 1.783% on September 2nd from 1.790% during the prior day. The September 2nd yield difference has been the lowest one since August 25th, when the spread was 1.704%.
Daily and Weekly Pivot Levels
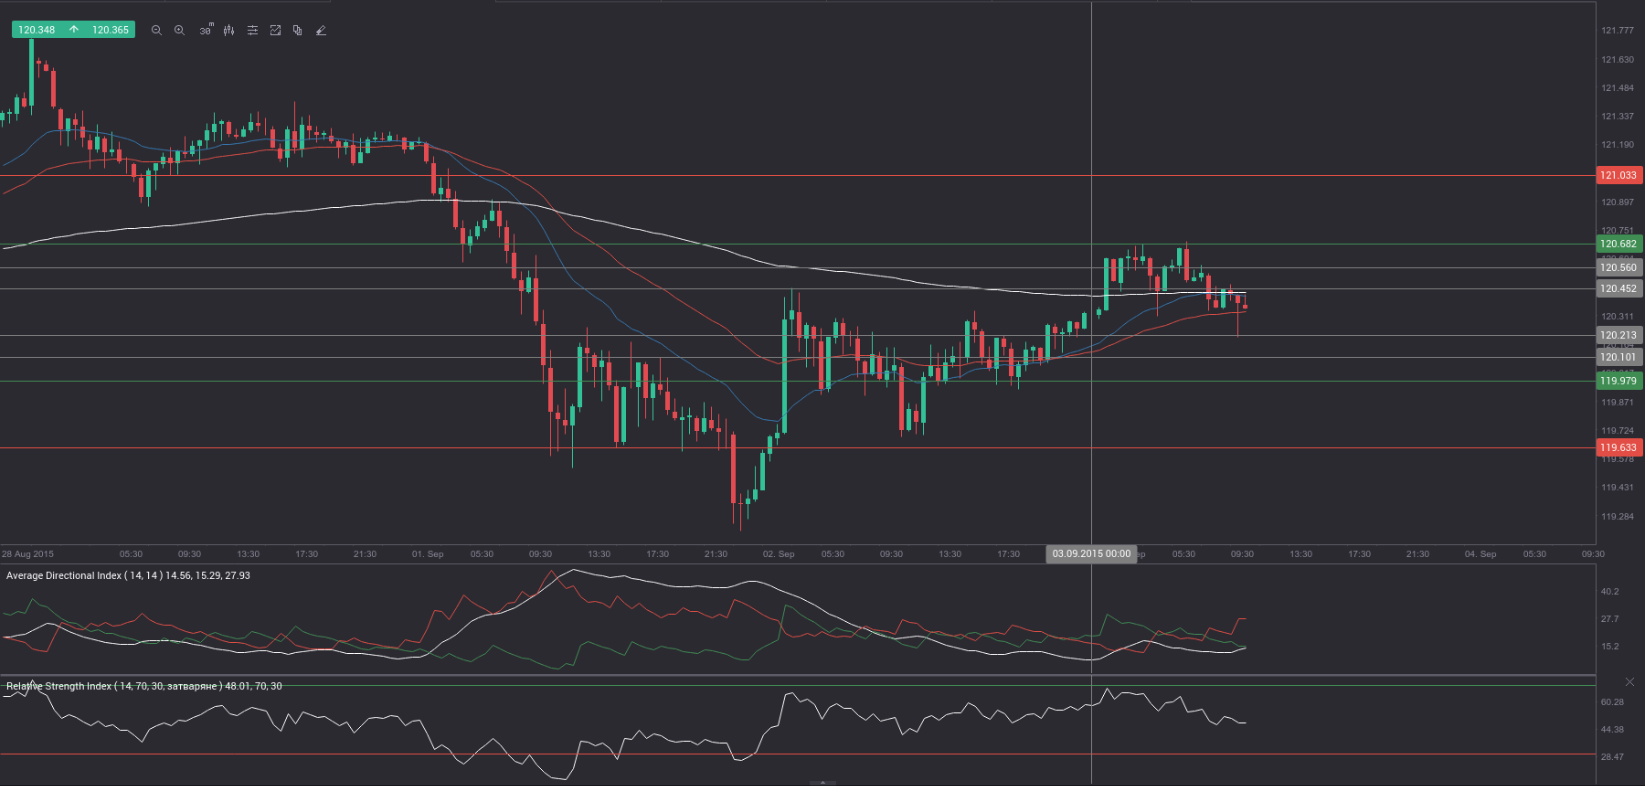
By employing the Camarilla calculation method, the daily pivot levels for USD/JPY are presented as follows:
R1 – 120.45
R2 – 120.56
R3 (range resistance – green on the 30-minute chart) – 120.68
R4 (range breakout – red on the 30-minute chart) – 121.03
S1 – 120.21
S2 – 120.10
S3 (range support – green on the 30-minute chart) – 119.98
S4 (range breakout – red on the 30-minute chart) – 119.63
By using the traditional method of calculation, the weekly pivot levels for USD/JPY are presented as follows:
Central Pivot Point – 120.07
R1 – 123.68
R2 – 125.64
R3 – 129.25
S1 – 118.11
S2 – 114.50
S3 – 112.54