Yesterday’s trade saw EUR/USD within the range of 1.1057-1.1125. The pair closed at 1.1081, down 0.12% on a daily basis and marking a third consecutive trading day of losses. The daily low has also been the lowest level since August 12th, when the cross registered a low of 1.1023.
At 6:48 GMT today EUR/USD was down 0.06% for the day to trade at 1.1071. The pair came close to the lower range breakout level (S4), as it touched a daily low at 1.1052 at 4:45 GMT. It is now the new lowest level since August 12th.
Today the cross may be influenced by a number of macroeconomic reports as listed below.
Fundamentals
United States
Housing starts and building permits
The number of housing starts in the United States probably increased a second month in a row in July to reach 1.190 million units, according to market expectations, from the seasonally adjusted annual rate of 1.174 million during the prior month. If so, this would be the highest level since October 2007, when 1.232 million housing starts were reported. Junes increase in housing starts was supported by construction of multi-family houses, including apartments and condominiums, which rose 29.4%. At the same time, construction of single-family houses shrank 0.9% to 685 000 units during the same month, according to the report by the US Census Bureau. The rate for units in buildings with five units or more was 476 000 in June.
Housing starts represent a gauge to measure residential units, on which construction has already begun every month. A start in construction is defined as the foundation laying of a building and it encompasses residential housing primarily.
The number of building permits in the country probably decreased to 1.232 million in July from an annual level of 1.343 million in June. The latter has been the highest number of permits since July 2007, when a level of 1.389 million was reported. Single-family authorizations rose at a monthly rate of 0.9% to 687 000 units in June, while authorizations of units in buildings with five units or more were reported at 621 000.
Building permits are permits, issued in order to allow excavation. An increase in the number of building permits and housing starts usually occurs a few months after mortgage rates in the country have been reduced. Authorizations are not required in all regions of the United States. Building permits, as an indicator, provide clues in regard to demand in the US housing market. In case a lower-than-anticipated figure is reported, this will trim demand for the US dollar. The official housing data is due out at 12:30 GMT.
Bond Yield Spread
The yield on German 2-year government bonds went as high as -0.251% on August 17th, or the highest level since August 7th (-0.237%), after which it slid to -0.260% at the close to gain 0.007 percentage point on a daily basis.
The yield on US 2-year government bonds climbed as high as 0.730% on August 17th, after which it fell to 0.706% at the close to lose 2 basis points (0.02 percentage point) for the day.
The spread between 2-year US and 2-year German bond yields, which reflects the flow of funds in a short term, shrank to 0.966% on August 17th from 0.993% on August 14th. The August 17th yield spread has been the lowest one since August 12th, when the difference was 0.948%.
Meanwhile, the yield on German 10-year government bonds soared as high as 0.663% on August 17th, or the same high as reported on August 14th, after which it slid to 0.631% at the close to depreciate 2.6 basis points (0.026 percentage point) compared to August 14th. It has been the first decrease in the past three trading days.
The yield on US 10-year government bonds climbed as high as 2.201% on August 17th, after which it slipped to 2.164% at the close to lose 3.7 basis points (0.037 percentage point) on a daily basis. It has been the first drop in the past four trading days.
The spread between 10-year US and 10-year German bond yields narrowed to 1.533% on August 17th from 1.544% on August 14th. The August 17th yield difference has been the lowest one since August 11th, when the spread was 1.514%.
Daily and Weekly Pivot Levels
By employing the Camarilla calculation method, the daily pivot levels for EUR/USD are presented as follows:
R1 – 1.1087
R2 – 1.1093
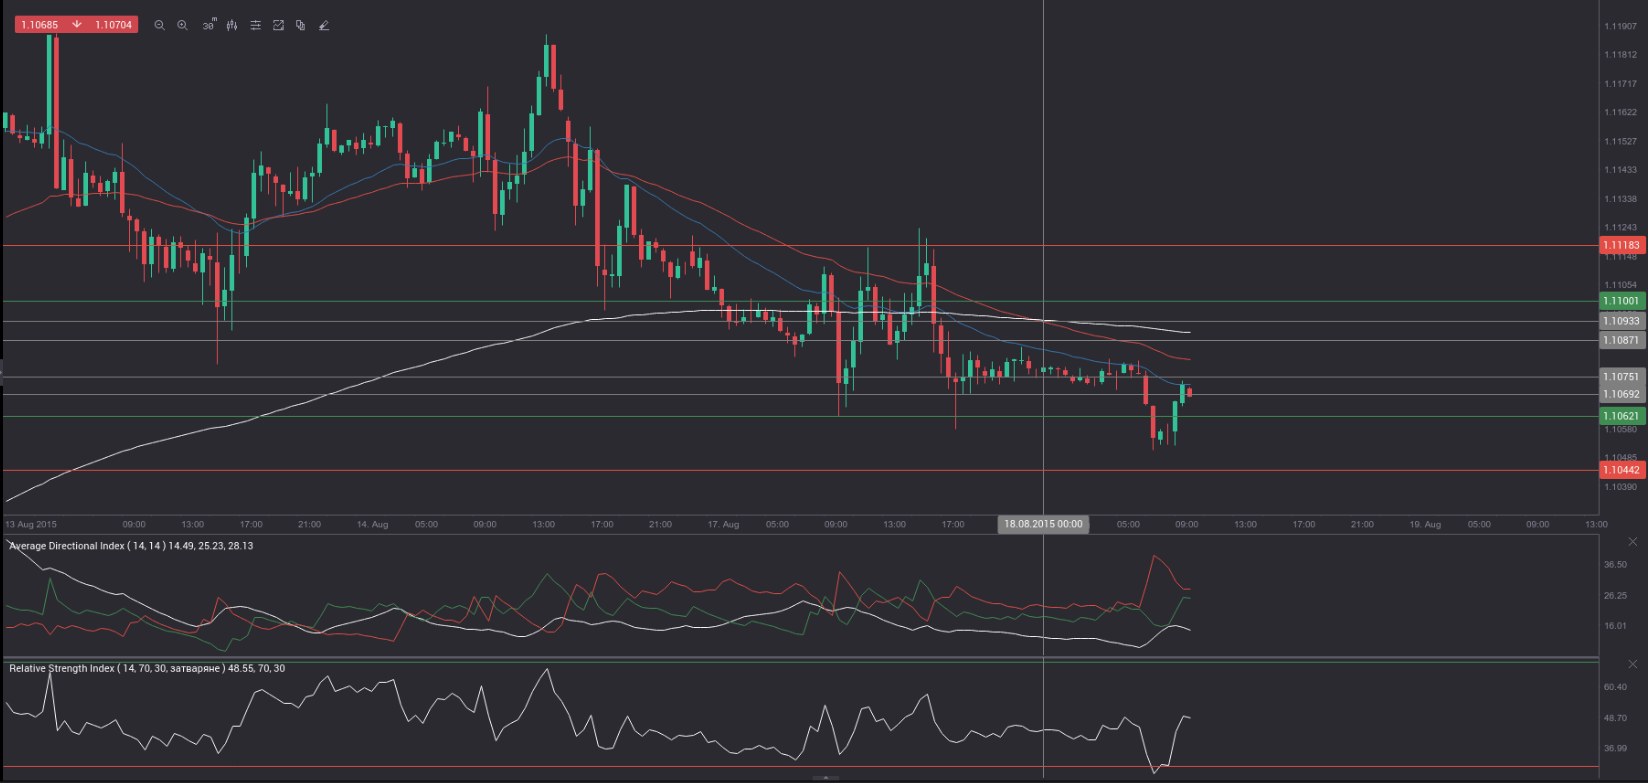
R3 (range resistance – green on the 30-minute chart) – 1.1100
R4 (range breakout – red on the 30-minute chart) – 1.1118
S1 – 1.1075
S2 – 1.1069
S3 (range support – green on the 30-minute chart) – 1.1062
S4 (range breakout – red on the 30-minute chart) – 1.1044
By using the traditional method of calculation, the weekly pivot levels for EUR/USD are presented as follows:
Central Pivot Point – 1.1081
R1 – 1.1238
R2 – 1.1370
R3 – 1.1527
S1 – 1.0949
S2 – 1.0792
S3 – 1.0660