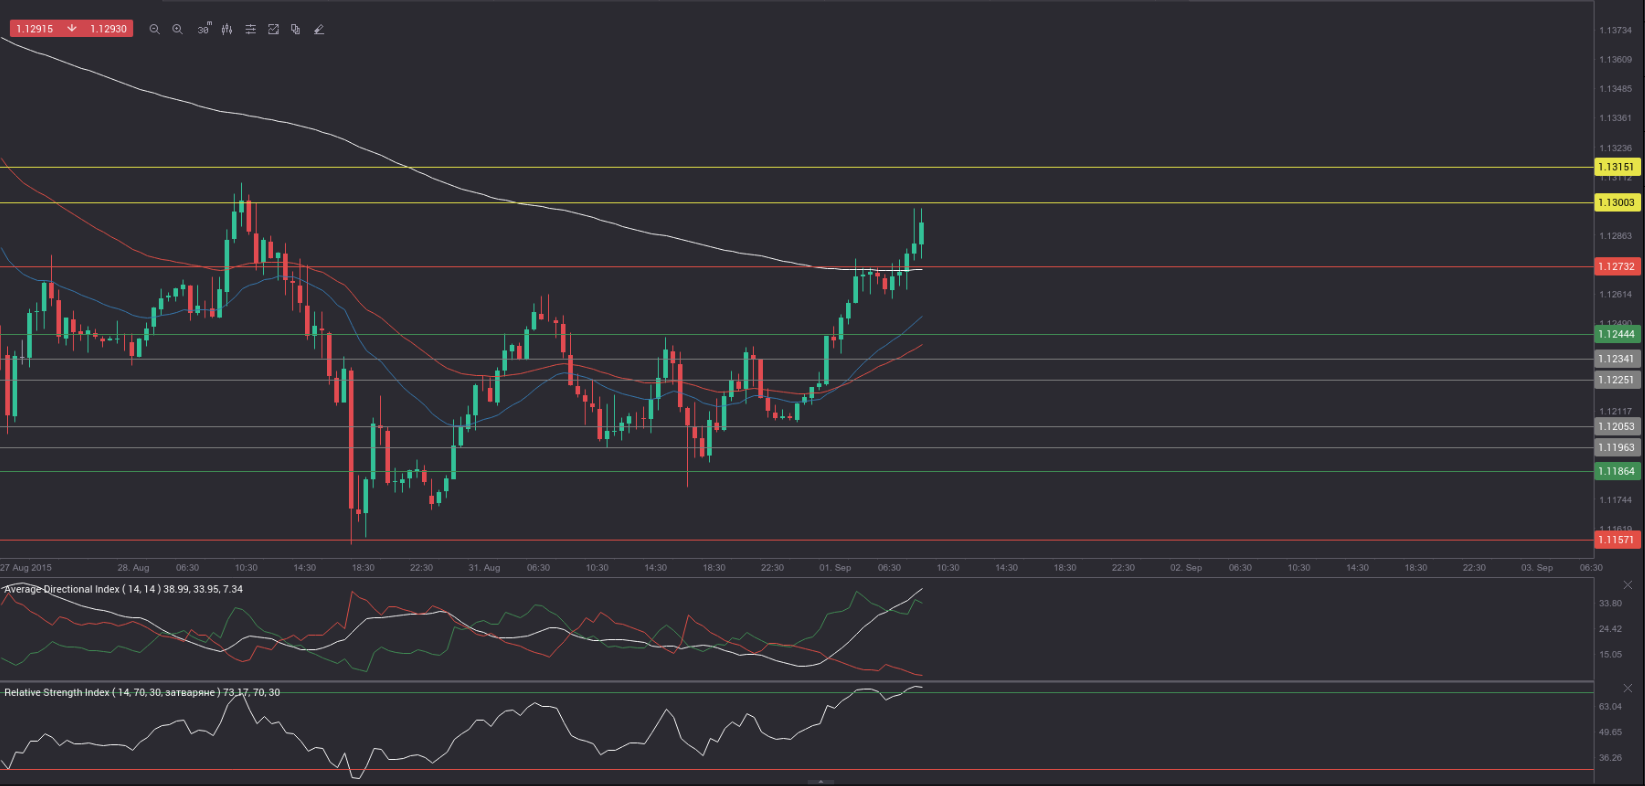
Yesterday’s trade saw EUR/USD within the range of 1.1159-1.1264. The pair closed at 1.1215, ticking up 0.03% on a daily basis and following four consecutive trading days of losses.
At 6:39 GMT today EUR/USD was up 0.61% for the day to trade at 1.1282. The pair overcame the upper range breakout level (R4), as it touched a daily high at 1.1298 at 6:14 GMT, or the highest level since last Friday. Resistance may be encountered next within the 1.1300-1.1315 area.
Today the cross may be influenced by a number of macroeconomic reports as listed below.
Fundamentals
Euro area
Manufacturing data by Markit
Activity in Italys sector of manufacturing probably slowed down in August, with the corresponding PMI dipping to 54.8, as expected by experts. In July the PMI stood at 55.3, or the highest level in more than four years. Markit Economics is expected to release the official data at 7:45 GMT.
Frances final manufacturing PMI probably remained in the zone of contraction for a second straight month in August, while confirming the preliminary PMI reading of 48.6, which was reported on August 21st. If so, this would be the lowest PMI level since April, when the index was reported at a final 48.0. The official PMI is due out at 7:50 GMT.
The final reading of German manufacturing PMI probably confirmed the preliminary value for August, with the index coming in at 53.2. If so, this would be the highest PMI level since April 2014, when a final reading of 54.1 was reported. August would also be the ninth consecutive month of expansion in activity. In July the final PMI stood at 51.8, up from a preliminary value of 51.5. Markit will release the official reading at 7:55 GMT.
The final manufacturing PMI in the Euro zone probably also confirmed the preliminary value in August, with the index remaining at 52.4. If so, it would also match the final PMI reported in July. August would also be the 26th consecutive month, during which the PMI inhabited the area above 50.0. The PMI reflects the performance of the manufacturing sector in the Euro area and is based on a survey of 3 000 manufacturing companies. National data are included for Germany, France, Italy, Spain, the Netherlands, Austria, the Republic of Ireland and Greece. These member states together account for almost 90% of Euro zones manufacturing activity. The Manufacturing Purchasing Managers Index is comprised by five individual indexes with the following weights: New Orders (30%), Output (25%), Employment (20%), Suppliers’ Delivery Times (15%) and Stock of Items Purchased (10%), as the Delivery Times index is inverted, so that it moves in a comparable direction.
In case the final PMI readings exceeded expectations, this would have a strong bullish effect on the common currency. The official manufacturing data for the Euro region as a whole is scheduled to be released at 8:00 GMT.
German Unemployment rate
The number of the unemployed people in Germany probably dropped by 3 000 in August, according to the median forecast by experts, following an unexpected increase by 9 000, reported in July. The latter has been the first increase in the past ten months. A decrease implies that consumer spending may be more active, while the latter is tightly related to economic growth. A surge in the number of the unemployed suggests the opposite.
At the same time, the seasonally adjusted rate of unemployment in the country probably remained steady at 6.4% for the sixth straight month in August, according to expectations. This has been the lowest rate on record.
The seasonally adjusted harmonized jobless rate stood at 4.7% for a fifth month in a row in June. It has been the lowest rate since 1981. The number of unemployed persons dropped 0.5% to 1.97 million in June compared to May, while employment was almost unchanged at 39.87 million persons in June.
The unemployment rate for people aged between 15 and 24 was steady at 7.1% in June compared to May, while falling from 7.7% in June 2014.
In case the number of people unemployed decreased more than projected and the unemployment rate dropped, this would strongly support demand for the euro. The Federal Statistics Office will release the official numbers at 7:55 GMT.
Italian Unemployment rate
The rate of unemployment in Italy probably lowered to 12.6% in July, according to the median forecast by experts, from 12.7% during the prior month. The number of unemployed people increased to 3.233 million in June from 3.178 million in May. At the same time, employment in the country was 0.1% lower at 55.8% to reach 22.297 million persons in June. Youth unemployment rate climbed 1.9% to a new all-time high of 44.2% in June, according to the National Institute of Statistics.
In case the rate of unemployment fell more than anticipated, this might provide a limited support to the single currency. Istat is to release the official report at 8:00 GMT.
Italian Gross Domestic Product – final estimate
The final estimate of Italys annual Gross Domestic Product probably pointed to a 0.5% expansion in the second quarter of 2015, according to the median forecast by experts, while confirming the preliminary estimate, released on August 14th. If so, this would be a second straight quarter of positive growth and also the fastest annual rate of increase since Q1 2011, when Italian economy expanded at a final 1.0%. The GDP picked up at a modest 0.1% during the first quarter of 2015, according to final data, while the provisional estimate pointed to zero growth.
On a quarterly basis, Italian economy probably expanded 0.2% in Q2, confirming the preliminary estimate. According to provisional data, in Q2 growth was supported by a surge in domestic demand, while trade deficits had a negative contribution to the economy. A look at the different segments revealed that the sector of services expanded, the industrial segment registered no growth with the exception of construction, while the sector of agriculture shrank.
In Q1 the nations GDP grew at a final rate of 0.3%, which confirmed the preliminary estimate.
In case a higher-than-projected rate of growth was reported, this would have a limited-to-moderate positive effect on the euro. The National Institute of Statistics (Istat) will release the final GDP data at 9:00 GMT.
Euro area Unemployment rate
The rate of unemployment in the Eurozone probably remained steady at 11.1% for a fourth successive month in July. It has been the lowest rate since April 2012, when unemployment in the region was recorded at 11.0%.
In June the lowest unemployment rates were recorded in Germany (4.7%) and the Czech Republic (4.9%), while the highest rates – in Greece (25.6%) and Spain (22.5%).
The EU 28 unemployment rate was reported at 9.6% in June, stable in comparison with May and down from 10.2% in comparison with June 2014. It has been the lowest rate since July 2011.
According to data by Eurostat, 24.296 million people in the EU28, of whom 17.756 million were in the Euro area, were unemployed in June. Compared with May the number of people unemployed decreased by 32 000 in the European Union and went up by 31 000 in the Eurozone. Compared with June 2014 unemployment was lower in the EU28 (a decrease by 1.448 million), while unemployed people in the Euro area were 811 000 fewer.
4.724 million people aged under 25 were not in employment in the EU28 in June, as 3.181 million of them were in the Eurozone. These numbers represented a decrease by 386 000 persons in the EU28 and by 225 000 persons in the Eurozone compared to June last year.
Unemployed are considered to be all persons aged between 15 and 74, who have not been hired during the survey period, have been actively seeking employment during the past four weeks and are able to accept any job proposition right away or in two weeks time. A drop in unemployment in the region would support the single currency. The official data by Eurostat is due out at 12:00 GMT.
United States
Manufacturing PMI by the ISM
Activity in United States’ manufacturing sector was probably little changed in August, with the corresponding manufacturing PMI coming in at a reading of 52.6, according to expectations, down from 52.7 in July. If so, this would be the lowest PMI reading since April, when the gauge was reported at 51.5. The New Orders Index came in at 56.5 in July from 56.0 in June. The sub-gauge of production was reported at 56, advancing from 54.0 in the preceding month. The index of employment slid to a value of 52.7 in July from 55.5 in June, indicating that employment levels rose but at a slower rate compared to June. The gauge of inventories of raw materials dropped to 49.5 in July from a reading of 53.0 in the previous month.
The Manufacturing Purchasing Managers’ Index (PMI) is a compound index, which represents manufacturing activity in 18 different industries. It is comprised by four equally-weighted components: seasonally adjusted employment, seasonally adjusted production inventories, seasonally adjusted new orders and supplier deliveries. The index is based on a survey of 300 purchasing managers.
Participants can either respond with “better”, “same”, or “worse” to the questions about the industry, in which they operate. The resulting PMI value is measured from 0 to 100. If the index shows a value of 100.0, this means that 100% of the respondents reported an improvement in conditions. If the index shows a value of 0, this means that 100% or the respondents reported a deterioration in conditions. If 100% of the respondents saw no change in conditions, the index will show a reading of 50.0. Therefore, readings above the key level of 50.0 are indicative of expanding activity in the sector of manufacturing. In case, however, the PMI slowed down more than anticipated, this would have a strong bearish effect on the greenback. The Institute for Supply Management (ISM) is to release the official reading at 14:00 GMT.
Bond Yield Spread
The yield on German 2-year government bonds went as high as -0.186% on August 31st, or the highest level since June 26th (-0.183%), after which it closed at the exact same level to add 1.9 basis points (0.019 percentage point) on a daily basis and to mark a fifth consecutive trading day of gains.
The yield on US 2-year government bonds climbed as high as 0.743% on August 31st, or the highest level since August 7th (0.749%), after which it fell to 0.739% at the close to add 1.5 basis points (0.015 percentage point) for the day. It has been a fifth straight trading day of gains.
The spread between 2-year US and 2-year German bond yields, which reflects the flow of funds in a short term, shrank to 0.925% on August 31st from 0.929% on August 28th. The August 31st yield spread has been the lowest one since August 27th, when the difference was 0.916%.
Meanwhile, the yield on German 10-year government bonds soared as high as 0.807% on August 31st, or the highest level since July 20th (0.813%), after which it closed at the exact same level to appreciate 8.1 basis points (0.081 percentage point) compared to August 28th.
The yield on US 10-year government bonds climbed as high as 2.220% on August 31st, or the highest level since August 19th (2.230%), after which it slipped to 2.214% at the close to add 3 basis points (0.03 percentage point) compared to August 28th.
The spread between 10-year US and 10-year German bond yields narrowed to 1.407% on August 31st from 1.458% on August 28th. The August 31st yield difference has been the lowest one since August 25th, when the spread was 1.325%.
Daily and Weekly Pivot Levels
By employing the Camarilla calculation method, the daily pivot levels for EUR/USD are presented as follows:
R1 – 1.1225
R2 – 1.1234
R3 (range resistance – green on the 30-minute chart) – 1.1244
R4 (range breakout – red on the 30-minute chart) – 1.1273
S1 – 1.1205
S2 – 1.1196
S3 (range support – green on the 30-minute chart) – 1.1186
S4 (range breakout – red on the 30-minute chart) – 1.1157
By using the traditional method of calculation, the weekly pivot levels for EUR/USD are presented as follows:
Central Pivot Point – 1.1348
R1 – 1.1542
R2 – 1.1904
R3 – 1.2098
S1 – 1.0986
S2 – 1.0792
S3 – 1.0430