Yesterday’s trade saw USD/JPY within the range of 123.68-124.50. The pair closed at 123.81, down 0.48% on a daily basis, or the first loss in the past three trading days. The daily rate of decrease has been the sharpest one since August 12th, when the cross slid 0.74%. The daily low has been the lowest level since July 31st, when the cross registered a low of 123.50.
At 8:48 GMT today USD/JPY was up 0.15% for the day to trade at 123.99. The pair overshot the range resistance level (R3), as it touched a daily high at 124.15 at 7:05 GMT.
Today the cross may be influenced by a number of macroeconomic reports as listed below.
Fundamentals
United States
Initial, Continuing Jobless Claims
The number of people in the United States, who filed for unemployment assistance for the first time during the business week ended on August 14th, probably decreased to 272 000, according to market expectations, from 274 000 in the prior week. The latter has been the highest number of claims since the business week ended on July 10th, when 281 000 claims were reported.
The 4-week moving average, an indicator lacking seasonal effects, was 266 250, marking a decrease of 1 750 compared to the preceding weeks revised down average. It has been the lowest level for this average since April 15th 2000.
The business week, which ended on August 7th has been the 23rd consecutive week, when jobless claims stood below the 300 000 threshold. This boosts the case labor market conditions in the country continued to improve. Claims are usually volatile during the summer period, as automakers shut assembly plants for annual retooling and also due to school vacations.
Initial jobless claims number is a short-term indicator, reflecting lay-offs in the country. In case the number of claims met expectations or dropped further, this would have a bullish effect on the US dollar.
The number of continuing jobless claims probably decreased to the seasonally adjusted 2 265 000 during the business week ended on August 7th from 2 273 000 in the prior week. The latter represented an increase by 15 000 compared to the revised up number of claims, reported in the business week ended on July 24th. This indicator reflects the actual number of people unemployed and currently receiving unemployment benefits, who filed for unemployment assistance at least two weeks ago.
The Department of Labor is to release the weekly report at 12:30 GMT.
Philadelphia FED manufacturing Index
The Philadelphia Fed Manufacturing Index probably improved to a reading of 7.0 in August from 5.7 index points during the previous month. The latter has been the lowest level since March 2015, when the gauge was reported at 5.0. The index is based on a monthly business survey (the Business Outlook Survey), measuring manufacturing activity in the third district of the Federal Reserve, Philadelphia. Participants give their opinion about the direction of business changes in overall economy and different indicators of activity in their companies, such as employment, working hours, new and existing orders, deliveries, inventories, delivery time, price etc. The survey is conducted every month since May 1968. The results are presented as the difference between the percentages of positive and negative projections. A level above zero is indicative of improving conditions, while a level below zero is indicative of worsening conditions. Higher-than-expected index readings would have a moderate bearish effect on the greenback. The Federal Reserve Bank of Philadelphia is expected to release the official results from the survey at 14:00 GMT.
Existing Home Sales
The index of existing home sales in the United States probably fell 0.6% to a level of 5.44 million in July compared to June, according to the median estimate by experts. If so, this would be the first drop in the past three months. In June compared to May existing home sales rose 3.2% to 5.49 million, or the highest level since May 2010 (5.66 million). The sample of data encompasses condos, co-ops and single-family houses.
Statistical data on existing home sales is often used along with statistical figures regarding the new home sales and pending home sales, with the major objective being to draw a conclusion how the nation’s housing sector is performing, regardless of interest rates. The most active house-purchasing period in the United States is usually between the months of March through June. Therefore, in case statistical data revealed a sudden drop in the number of homes sold rather than an improvement during this period, this would be considered as a signal of weakness in the country’s housing market.
The report on existing home sales usually does not cause a real direct impact on US economy. Actually, this effect appears to be minimal, due to the fact that nothing is produced with the mere sale of an existing home. In terms of economic activity, the sale of an existing house may be related only to interior design and purchases of new furniture.
In case the index dropped at a steeper monthly rate than anticipated, this would have a limited bearish effect on the US dollar. The National Association of Realtors (NAR) is to release the official figure at 14:00 GMT.
Bond Yield Spread
The yield on Japanese 2-year government bonds went as high as 0.009% on August 19th, or the highest level since August 17th (0.009%), after which it closed at the exact same level to gain 0.002 percentage point on a daily basis.
The yield on US 2-year government bonds climbed as high as 0.738% on August 19th, or the highest level since August 14th (0.738%), after which it fell to 0.665% at the close to lose 5.7 basis points (0.057 percentage point) for the day.
The spread between 2-year US and 2-year Japanese bond yields, which reflects the flow of funds in a short term, shrank to 0.656% on August 19th from 0.715% during the prior day. The August 19th yield difference has been the lowest one since August 3rd, when the spread was 0.654%.
Meanwhile, the yield on Japan’s 10-year government bonds soared as high as 0.381% on August 19th, after which it slid to 0.375% at the close to lose 0.002 percentage point compared to August 18th. It has been the second straight trading day of decrease.
The yield on US 10-year government bonds climbed as high as 2.230% on August 19th, or the highest level since August 11th (2.232%), after which it slipped to 2.131% at the close to lose 6.1 basis points (0.061 percentage point) on a daily basis. It has been the second drop in the past three trading days.
The spread between 10-year US and 10-year Japanese bond yields narrowed to 1.756% on August 19th from 1.815% during the prior day. The August 19th yield difference has been the lowest one since August 11th, when the spread was 1.742%.
Daily and Weekly Pivot Levels
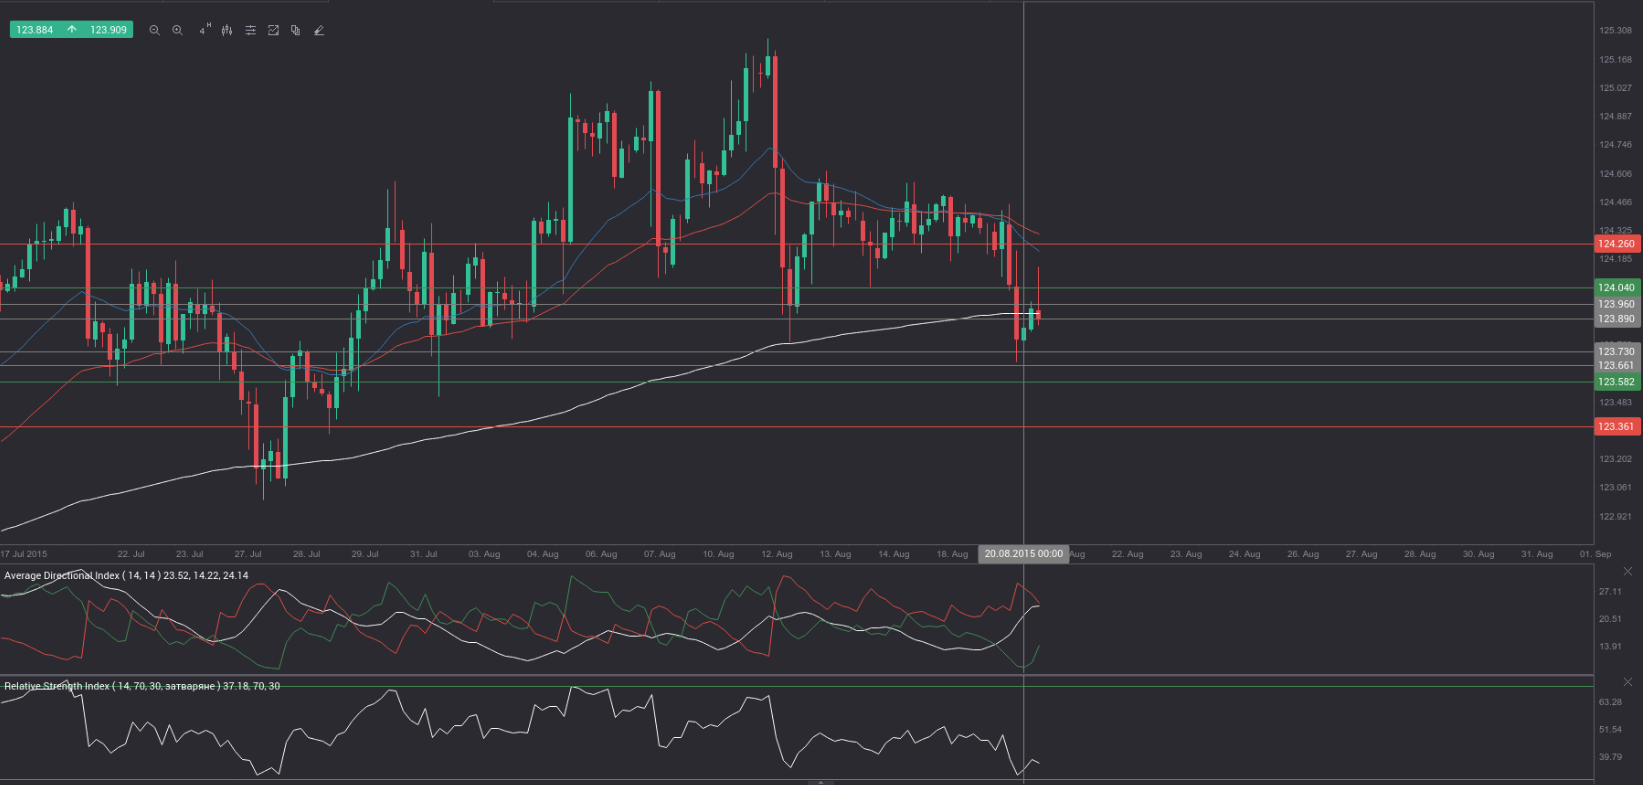
By employing the Camarilla calculation method, the daily pivot levels for USD/JPY are presented as follows:
R1 – 123.89
R2 – 123.96
R3 (range resistance – green on the 4-hour chart) – 124.04
R4 (range breakout – red on the 4-hour chart) – 124.26
S1 – 123.73
S2 – 123.66
S3 (range support – green on the 4-hour chart) – 123.58
S4 (range breakout – red on the 4-hour chart) – 123.36
By using the traditional method of calculation, the weekly pivot levels for USD/JPY are presented as follows:
Central Pivot Point – 124.46
R1 – 125.15
R2 – 125.99
R3 – 126.68
S1 – 123.62
S2 – 122.93
S3 – 122.09