On Friday gold for delivery in June traded within the range of $1,228.00-$1,248.50. Futures closed at $1,228.70, retreating 1.63% on a daily basis. It has been the 29th drop in the past 58 trading days, a third consecutive one and also the steepest one since April 14th, when the yellow metal plummeted 1.75%. The daily low has been the lowest price level since April 15th, when a low of $1,225.70 a troy ounce was registered. In weekly terms, gold fell 0.36% during the past week. It has been the 8th drop in the past 16 weeks and also a second consecutive one. The precious metal has trimmed its advance to 0.08% so far during the current month, following three consecutive months of gains.
On the Comex division of the New York Mercantile Exchange, gold futures for delivery in June were advancing 0.62% on Monday to trade at $1,236.30 per troy ounce. The precious metal went up as high as $1,238.85 during the late phase of the Asian trading session, while the current daily low was at $1,231.45 per troy ounce, recorded during early Asian trade.
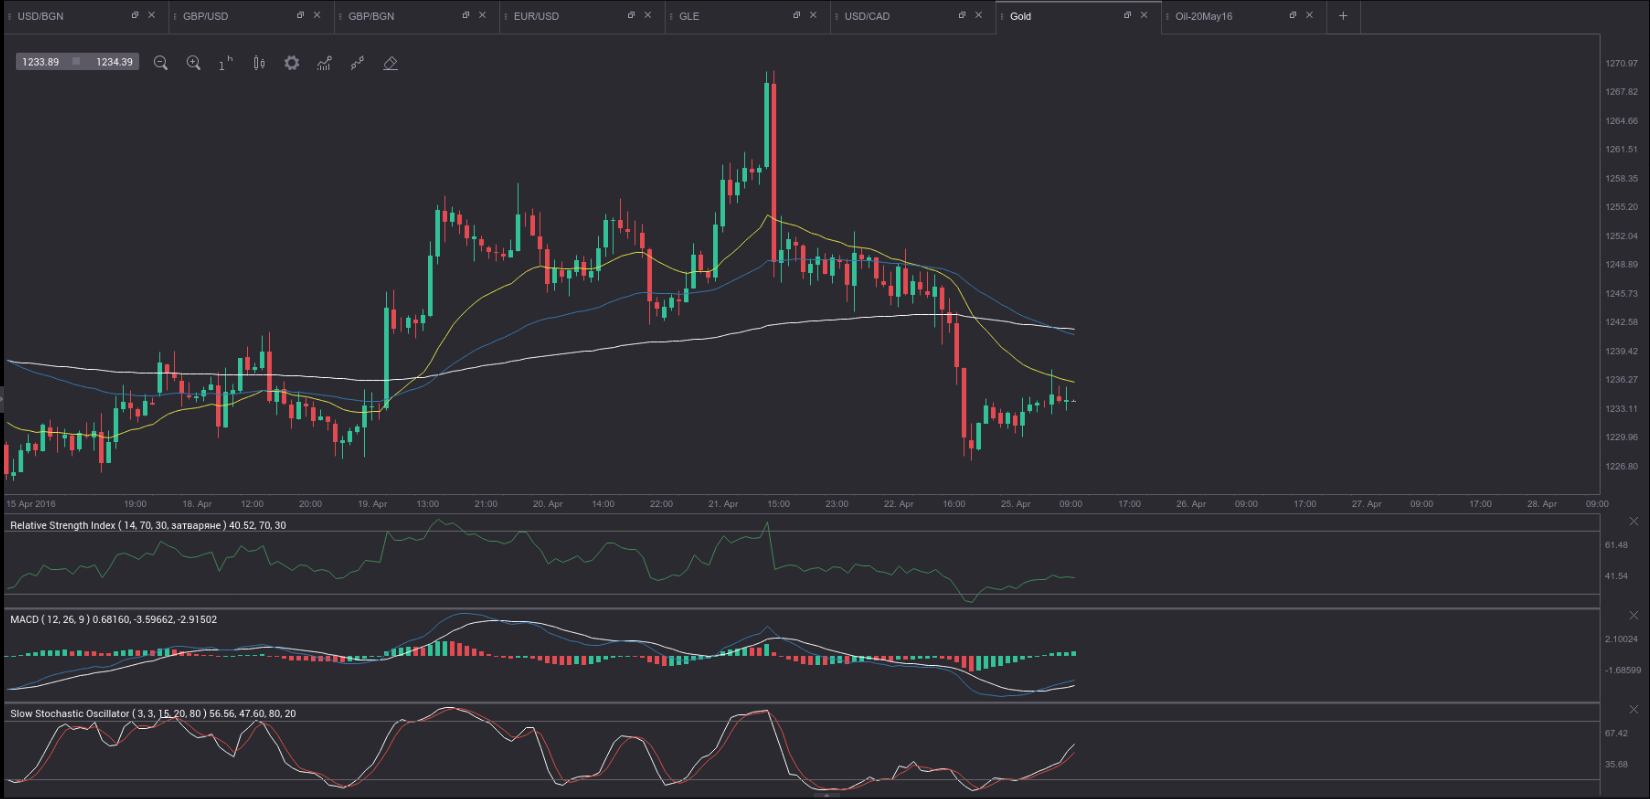
The commodity has recently been oversold, as indicated by the hourly 14-period RSI and the hourly Slow Stochastic. The rebound from April 22nd lows was also supported by the hourly MACD, which indicated bullish momentum has begun to build up. However, the precious metal has already found resistance at the hourly 21-period Exponential Moving Average (yellow on the chart below) during late Asian trade. In addition, the 21-period, the 55-period and the 200-period EMAs has just formed a perfect order, suggesting a probable continuation of the move to the downside. If that turns out to be the case, the commodity may receive support at the low from April 22nd ($1,228.00) and then – at the low from April 15th ($1,225.70).
In case, however, bullish momentum continues to increase and we see a break and close above the hourly 21-period EMA, resistance may be expected at the hourly 55-period EMA ($1,241.13), the hourly 200-period EMA ($1,241.76) and finally – at the high from April 22nd ($1,248.50).
Meanwhile, silver futures for delivery in May were gaining 0.92% on the day to trade at $17.055 per troy ounce, after going up as high as $17.135 a troy ounce during the late phase of the Asian trading session. Last week silver added 3.60% to its value to mark its 10th gain out of the past 16 weeks and also a third consecutive one. Futures have advanced 10.22% so far during the current month, following three successive months of gains.
Daily and Weekly Pivot Levels
By employing the traditional calculation method, the daily pivot levels for gold are presented as follows:
Central Pivot Point – $1,235.07
R1 – $1,242.13
R2 – $1,255.57
R3 – $1,262.63
S1 – $1,221.63
S2 – $1,214.57
S3 – $1,201.13
By using the traditional method of calculation again, the weekly pivot levels for gold are presented as follows:
Central Pivot Point – $1,242.43
R1 – $1,256.87
R2 – $1,285.03
R3 – $1,299.47
S1 – $1,214.27
S2 – $1,199.83
S3 – $1,171.67