Friday’s trade saw USD/JPY within the range of 123.89-124.23. The pair closed at 124.08, down 0.06% on a daily basis, which has been the first loss in the past three trading days. The daily high has also been the highest level since June 24th, when the cross registered a high of 124.38.
At 9:30 GMT today USD/JPY was up 0.18% for the day to trade at 124.28. The pair broke the daily R1 level and touched a daily high at 124.30 at 8:25 GMT. It is now the new highest level since June 24th.
No relevant macroeconomic reports are scheduled for release from the United States and Japan today.
Japan celebrates the Marine Day holiday
Known as “Ocean Day” or “Sea Day”, the Marine Day holiday is observed by the Japanese people on every third Monday in the month of July. On this day the Japanese give thanks to the ocean’s bounty, which is meant to underscore how vital the ocean for the island nation is.
Banks in Japan are to remain closed.
Correlation with other Majors
Taking into account the week ended on July 19th and the daily closing levels of the major currency pairs, we come to the following conclusions in regard to the strength of relationship:
USD/JPY to USD/CAD (0.9645, or very strong)
USD/JPY to USD/CHF (0.9193, or very strong)
USD/JPY to GBP/USD (0.3377, or moderate)
USD/JPY to AUD/USD (-0.6565, or strong)
USD/JPY to EUR/USD (-0.9515, or very strong)
USD/JPY to NZD/USD (-0.9942, or very strong)
1. During the examined period USD/JPY moved almost equally in one and the same direction with USD/CAD and USD/CHF.
2. USD/JPY moved strongly in the opposite direction compared to AUD/USD during the past week.
3. The relation between USD/JPY and GBP/USD was moderate.
4. USD/JPY moved almost equally in the opposite direction compared to EUR/USD.
5. The negative correlation between USD/JPY and NZD/USD was almost perfect during the period in question.
Bond Yield Spread
The yield on Japanese 2-year government bonds went as high as 0.010% on July 17th, after which it closed at the same level to show no change on a daily basis.
The yield on US 2-year government bonds climbed as high as 0.686% on July 17th, or the highest level since July 2nd (0.716%), after which it fell to 0.669% at the close to gain 0.008 percentage point for the day, while marking a second straight day of increase.
The spread between 2-year US and 2-year Japanese bond yields, which reflects the flow of funds in a short term, expanded to 0.659% on July 17th from 0.655% during the prior day. The July 17th yield difference has been the most notable one since July 13th, when the spread was 0.671%.
Meanwhile, the yield on Japanese 10-year government bonds soared as high as 0.455% on July 17th, after which it slid to 0.445% at the close to lose 1 basis point (0.01 percentage point) compared to July 16th, while marking a second straight day of decrease.
The yield on US 10-year government bonds climbed as high as 2.374% on July 17th, after which it slipped to 2.347% at the close to lose 0.009 percentage point on a daily basis.
The spread between 10-year US and 10-year Japanese bond yields narrowed to 1.902% on July 17th from 1.904% during the prior day. The July 17th yield difference has been the lowest one since July 8th, when the spread was 1.740%.
Technical Outlook
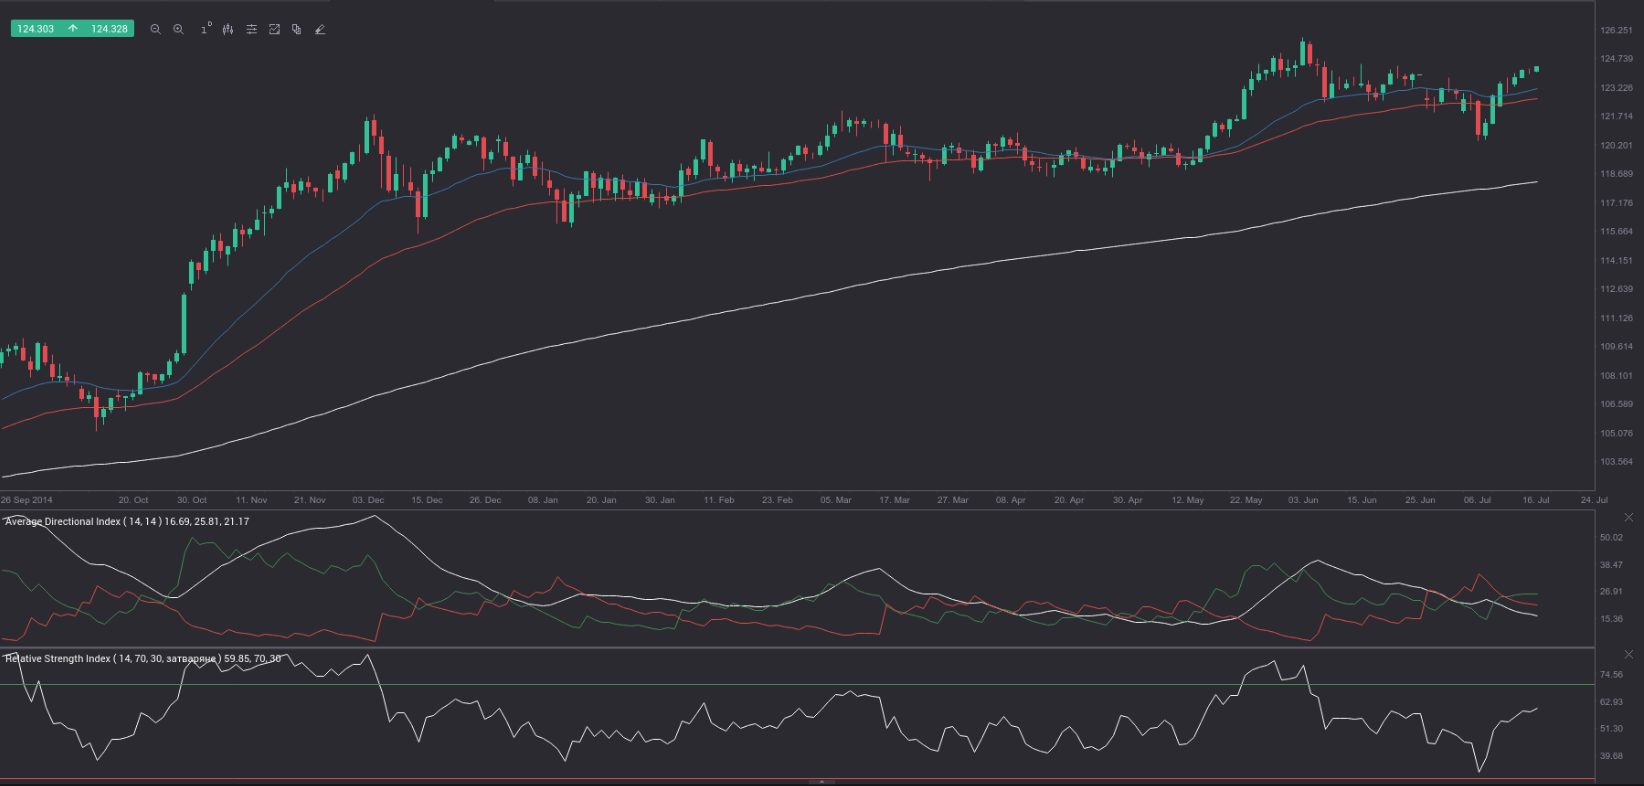
The bull trend, which began in late 2012 as a ”spike and channel trend”, is still in play. The perfect order of the 25-day (blue on the daily chart), the 50-day (red) and the 200-day (white) Exponential Moving Averages is intact. In addition, the Relative Strength Index (RSI) is conveniently above its 50.00 level and still has some room to run before reaching the overbought area. The +DI (green) has crossed above the -DI (red) and the distance between them is poised to widen. The Average Directional Movement Index (ADX) (white on the chart), on the other hand, has slumped below the 30.00 level from above, which suggests there has been a decline in momentum. What is more, the ADX has fallen below its key 20.00 level, which indicates that a trading range is probably on the horizon.
Regardless of whether USD/JPY is entering a range-type area, in case we witness a bullish breakout and a close above the June 5th 2015 high of 125.86 (the highest level in at least 8 years), we expect continuation of the bull trend in the upcoming weeks.
Pivot Points
According to Binary Tribune’s daily analysis, the central pivot point for the pair is at 124.07. In case USD/JPY manages to breach the first resistance level at 124.24, it will probably continue up to test 124.41. In case the second key resistance is broken, the pair will probably attempt to advance to 124.58.
If USD/JPY manages to breach the first key support at 123.90, it will probably continue to slide and test 123.73. With this second key support broken, the movement to the downside will probably continue to 123.56.
The mid-Pivot levels for today are as follows: M1 – 123.65, M2 – 123.82, M3 – 123.99, M4 – 124.16, M5 – 124.33, M6 – 124.50.
In weekly terms, the central pivot point is at 123.44. The three key resistance levels are as follows: R1 – 124.87, R2 – 125.67, R3 – 127.10. The three key support levels are: S1 – 122.64, S2 – 121.21, S3 – 120.41.