Yesterday’s trade saw USD/CAD within the range of 1.1130-1.1222. The pair closed at 1.1199, gaining 0.32% on a daily basis.
At 9:12 GMT today USD/CAD was up 0.04% for the day to trade at 1.1201. The pair touched a daily high at 1.1223 at 1:30 GMT.
Fundamental view
United States
Change in Employment
Employers in the US non-farm private sector probably added 200 000 new jobs during September, according to the median estimate by experts, following 204 000 new positions added in August. The latter has been the slowest pace of job growth since May. The employment report by Automated Data Processing Inc. (ADP) is based on data that encompasses 400 000 – 500 000 companies employing over 24 million people, working in the 19 major sectors of the economy. The ADP employment change indicator is calculated in accordance with the same methodology, which the Bureau of Labor Statistics (BLS) uses. Published two days ahead of governments employment statistics, this report is used by traders as a reliable predictor of the official non-farm payrolls data. Creation of jobs is considered of utmost importance for consumer spending, while the latter is a major driving force behind economic growth. In case expectations were exceeded, this would bolster demand for the dollar. The official figure is scheduled to be published at 12:15 GMT.
ISM Manufacturing
Activity in United States’ manufacturing sector probably remained little changed in September, with the corresponding manufacturing PMI coming in at a reading of 58.5, according to expectations, down from 59.0 in the prior month. Augusts value has been the highest since March 2011 and has been bolstered by an increase in gauges of production and new orders. The New Orders Index was reported at 66.7 in August, or an increase by 3.3 points from 63.4 in July, which spoke of growth in new orders for the 15th successive month. The index of Production came in at 64.5, or an increase by 3.3 points compared to Julys reading of 61.2, according to data by the Institute for Supply Management.
The Manufacturing Purchasing Managers’ Index (PMI) is a compound index, which represents manufacturing activity in 20 different industries. It is comprised by four equally-weighted components: seasonally adjusted employment, seasonally adjusted production inventories, seasonally adjusted new orders and supplier deliveries. The index is based on a survey of 300 purchasing managers.
Participants can either respond with “better”, “same”, or “worse” to the questions about the industry, in which they operate. The resulting PMI value is measured from 0 to 100. If the index shows a value of 100.0, this means that 100% of the respondents reported an improvement in conditions. If the index shows a value of 0, this means that 100% or the respondents reported a deterioration in conditions. If 100% of the respondents saw no change in conditions, the index will show a reading of 50.0. Therefore, readings above the key level of 50.0 are indicative of expanding activity in the sector of manufacturing. Higher than projected values would certainly provide support to the US dollar. The Institute for Supply Management (ISM) is to release the official PMI reading at 14:00 GMT.
Canada
The RBC Canadian Manufacturing PMI probably slowed down to 54.5 in September, according to the median analysts’ estimate, from 54.8 in the prior month. Augusts reading has been the strongest since November 2013.
The PMI report is based on data collected from monthly replies to questionnaires sent to supply managers in over 400 industrial companies. The RBC PMI is a compound index based on five individual indexes: new orders, production, employment, delivery time, stocks of purchases. Values of the index above the key level of 50.0 indicate overall increase in activity in the sector, while readings below 50.0 are indicative of contraction in activity. PMI studies are earlier indicators of economic conditions published each month and are available much before the publication of relevant data from government authorities.
Royal Bank of Canada will release its official report at 13:30 GMT. In case activity in the sector slowed down more than expected, this would have a bearish effect on the loonie.
Technical view
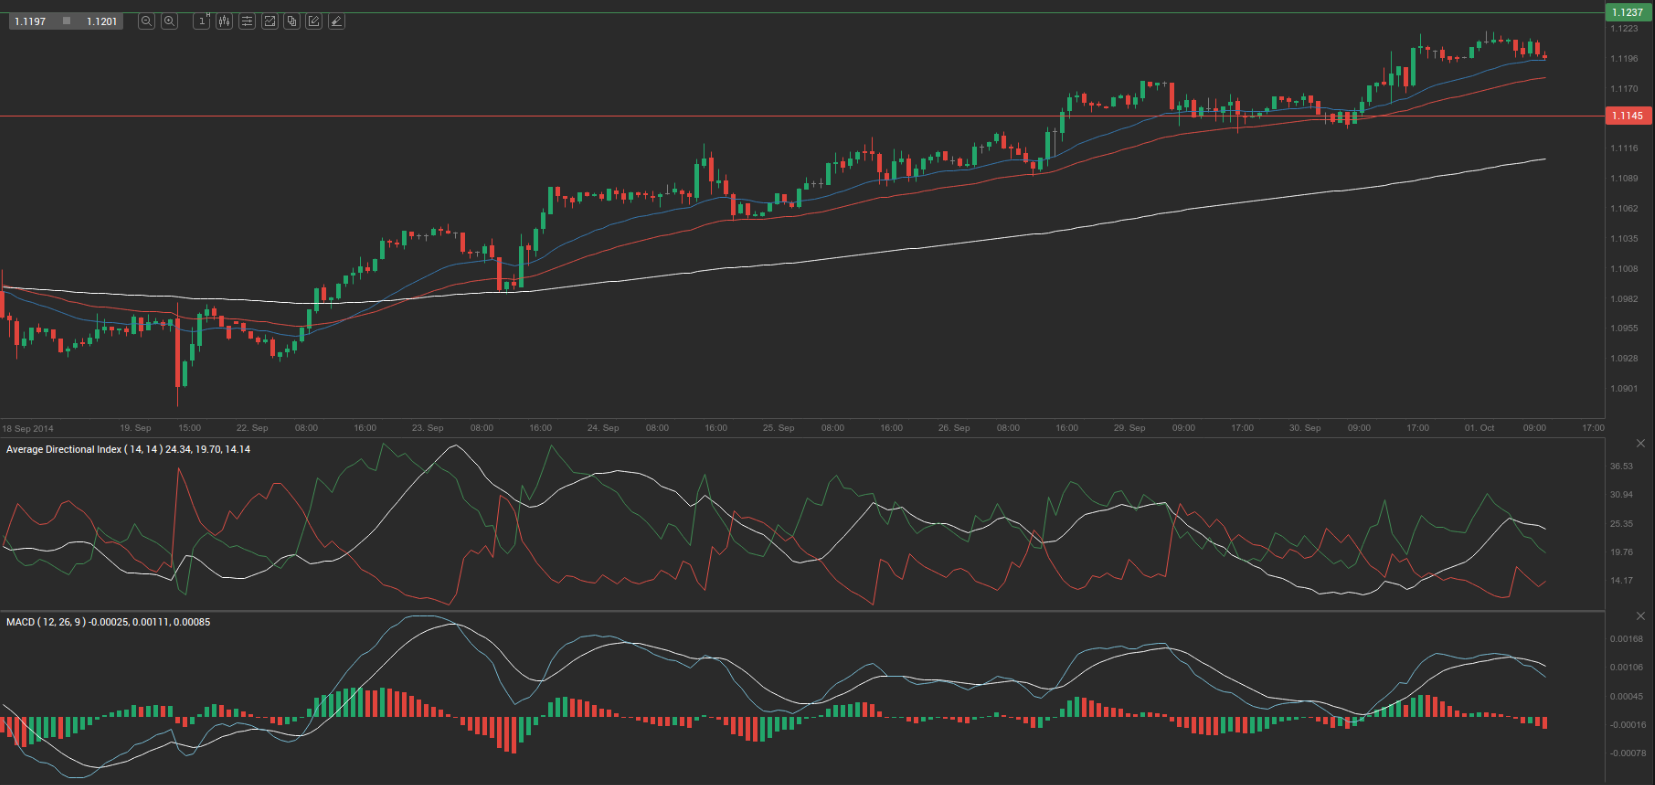
According to Binary Tribune’s daily analysis, the central pivot point for the pair is at 1.1184. In case USD/CAD manages to breach the first resistance level at 1.1237, it will probably continue up to test 1.1276. In case the second key resistance is broken, the pair will probably attempt to advance to 1.1329.
If USD/CAD manages to breach the first key support at 1.1145, it will probably continue to slide and test 1.1092. With this second key support broken, the movement to the downside will probably continue to 1.1053.
The mid-Pivot levels for today are as follows: M1 – 1.1073, M2 – 1.1119, M3 – 1.1165, M4 – 1.1211, M5 – 1.1257, M6 – 1.1303.
In weekly terms, the central pivot point is at 1.1083. The three key resistance levels are as follows: R1 – 1.1243, R2 – 1.1332, R3 – 1.1492. The three key support levels are: S1 – 1.0994, S2 – 1.0834, S3 – 1.0745.