Yesterday’s trade saw USD/ZAR within the range of 11.1030-11.1787. The pair closed at 11.1282, losing 0.41% on a daily basis.
At 7:52 GMT today USD/ZAR was up 0.35% for the day to trade at 11.1723. The pair broke the first key daily and the first key weekly resistance levels and touched a daily high at 11.1875 at 6:50 GMT.
Fundamental view
United States
Orders for durable goods
Durable goods orders in the United States probably dropped 18.0% in August compared to a month ago, according to the median forecast by experts. In July new orders for manufactured durable goods climbed at the highest pace on record, 22.6%, to reach 300.1 billion USD, due to increased demand for non-defense aircraft. Nondefense new orders for capital goods rose by 51.5 billion USD (60.8%) to 136.3 billion USD in July, while shipments increased by 1.1 billion USD (1.4%) to 79.1 billion USD, according to data by the US Census Bureau.
Durable goods orders, as an indicator, gauge the strength of US manufacturing sector and represent a major portion of nations factory orders. This is a closely watched report on manufacturing activity, because durable goods are the first type of goods to be affected by an economic downturn or upturn.
Durable goods are designed to last three or more years and encompass aircraft, automobiles and buses, cranes, machine parts, appliances etc. More than 85 industries are represented in the sample, which covers the entire United States. The logic behind this indicator is that consumers need to be very optimistic in order to buy an automobile in comparison with, for example, first necessities such as food or clothing. Therefore, durable goods are among the first goods, which a consumer may abstain from purchasing, in case overall economic activity begins to contract. The same is valid for company purchases. During a recession, an airliner is less likely to purchase new planes and as factory output contracts, it is less likely to purchase new machines.
Durable goods orders, which exclude transportation, probably rose 0.7% in August, following a 0.8% drop in July. Large ticket orders, such as automobiles for civil use or aircraft, are not present in the calculation, as their value may be in a wide range. This way the index provides a more reliable information in regard to orders of durable goods.
In case orders decreased at a faster pace than projected, this would certainly have a bearish effect on the greenback. US Census Bureau is scheduled to release the official numbers at 12:30 GMT.
Initial, Continuing jobless claims
The number of people in the United States, who filed for unemployment assistance for the first time during the week ended on September 19th, probably rose to 300 000, after reaching an eight-week low of 280 000 in the prior week. The 4-week moving average was 299 500 during the week ended on September 13th, or a decrease by 4 750 compared to the prior weeks revised average. The previous weeks average was revised up by 250 from 304 000 to 304 250.
Initial jobless claims number is a short-term indicator, reflecting lay-offs in the country. In case the number of claims increased more than projected, this would have a bearish effect on the greenback.
The number of continuing jobless claims probably increased to the seasonally adjusted 2 450 000 during the week ended on September 12th, from 2 429 000 in the previous week. The latter has been the lowest level since May 2007. This indicator represents the actual number of people unemployed and currently receiving unemployment benefits, who filed for unemployment assistance at least two weeks ago.
The Department of Labor is to release the weekly report at 12:30 GMT.
Services PMI by Markit
Activity in the United States sector of services probably remained almost unchanged in September, with the corresponding preliminary Purchasing Managers Index coming in at a reading of 59.0. In August the final seasonally adjusted PMI stood at 59.5, or the lowest level since June. The index is based on data, collected from a representative panel of over 400 companies, operating in the U.S. service sector. Values above the key level of 50.0 indicate optimism (expanding activity). Lower than expected PMI readings might have a bearish effect on the US dollar. The preliminary data by Markit Economics is due out at 13:45 GMT.
South Africa
Producer prices in South Africa probably rose at an annualized pace of 7.7% in August, according to expectations, following an 8.0% increase in July, as the latter has been the slowest pace since February.
The Producer Price Index (PPI) measures the average change in commodity prices in South Africas primary markets. It consists of two types of indices: output indices, which measure changes in prices received by producers, and input indices, which measure changes in the cost of production, excluding labor and capital costs. The input indices cover the prices of fuel and electricity, materials, transport and communication, commission and contract services, rent and lease of land, buildings, vehicles and plants, business services, insurance premiums less claims.
Generally speaking, higher-than-expected PPI readings are considered as having a bullish effect on the local currency and vice versa. Statistics South Africa is to release the official report at 9:30 GMT.
Technical view
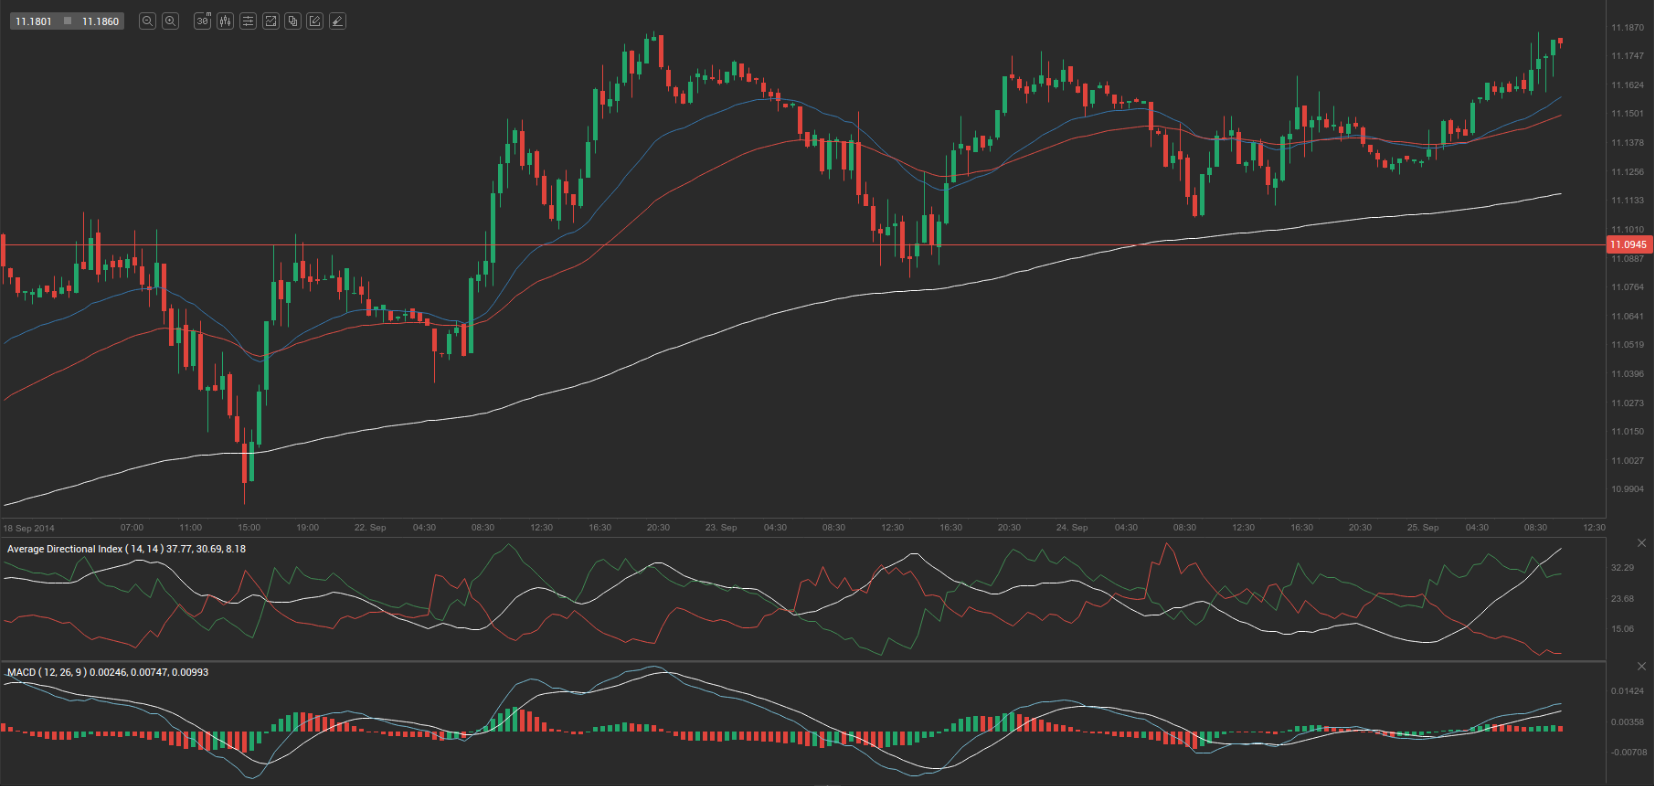
According to Binary Tribune’s daily analysis, the central pivot point for the pair is at 11.1366. In case USD/ZAR manages to breach the first resistance level at 11.1703, it will probably continue up to test 11.2123. In case the second key resistance is broken, the pair will probably attempt to advance to 11.2460.
If USD/ZAR manages to breach the first key support at 11.0945, it will probably continue to slide and test 11.0609. With this second key support broken, the movement to the downside will probably continue to 11.0189.
The mid-Pivot levels for today are as follows: M1 – 11.0399, M2 – 11.0778, M3 – 11.1156, M4 – 11.1535, M5 – 11.1913, M6 – 11.2292.
In weekly terms, the central pivot point is at 11.0197. The three key resistance levels are as follows: R1 – 11.1728, R2 – 11.2662, R3 – 11.4193. The three key support levels are: S1 – 10.9263, S2 – 10.7732, S3 – 10.6798.