Yesterday’s trade saw USD/MXN within the range of 13.2058-13.2682. The pair closed at 13.2360, losing 0.07% on a daily basis.
At 9:17 GMT today USD/MXN was down 0.11% for the day to trade at 13.2222. The pair touched a daily low at 13.2197 at 9:19 GMT.
Fundamental view
United States
The Conference Board Leading Economic Index for the United States probably increased 0.4% in August compared to a month ago, acording to the median estimate by experts. In July compared to June the index climbed 0.9%. It encompasses a variety of economic indicators, which signify possible changes in overall economic activity. The index is comprised by the following components: average weekly hours in manufacturing, average weekly initial claims for unemployment insurance, manufacturers’ new orders, consumer goods and materials, ISM Index of New Orders, manufacturers new orders, nondefense capital goods excluding aircraft orders, building permits, new private housing units, Stock prices, 500 common stocks, Leading Credit Index, interest rate spread, 10-year Treasury bonds less federal funds, average consumer expectations for business conditions. Higher than expected readings of the index are usually dollar positive. The Conference Board will release the official data at 14:00 GMT.
Technical view
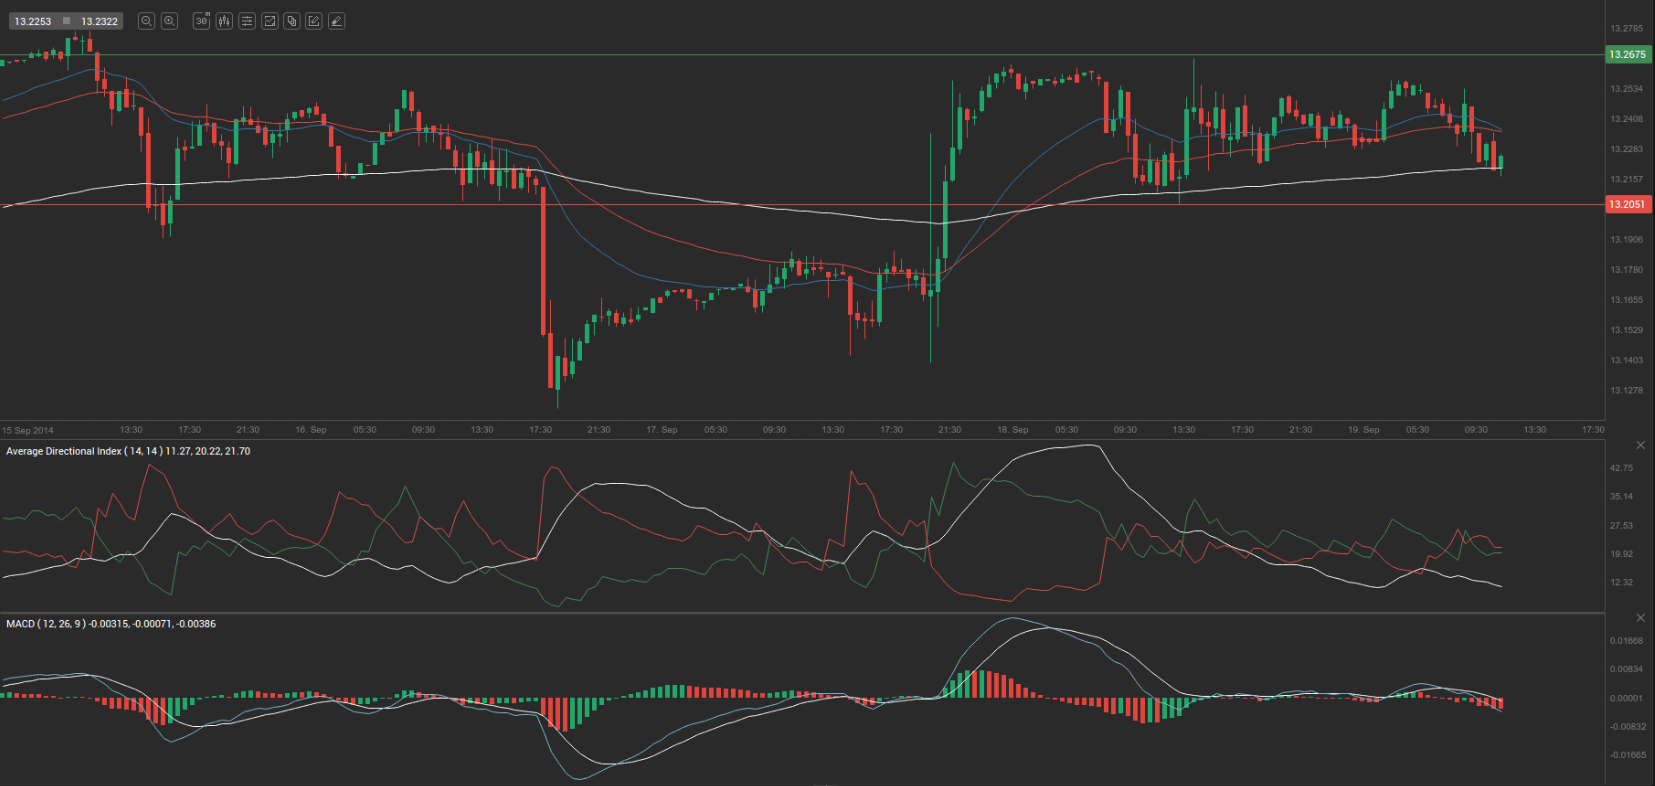
According to Binary Tribune’s daily analysis, the central pivot point for the pair is at 13.2367. In case USD/MXN manages to breach the first resistance level at 13.2675, it will probably continue up to test 13.2991. In case the second key resistance is broken, the pair will probably attempt to advance to 13.3299.
If USD/MXN manages to breach the first key support at 13.2051, it will probably continue to slide and test 13.1743. With this second key support broken, the movement to the downside will probably continue to 13.1427.
The mid-Pivot levels for today are as follows: M1 – 13.1585, M2 – 13.1897, M3 – 13.2209, M4 – 13.2521, M5 – 13.2833, M6 – 13.3145.
In weekly terms, the central pivot point is at 13.1928. The three key resistance levels are as follows: R1 – 13.3584, R2 – 13.4632, R3 – 13.6288. The three key support levels are: S1 – 13.0880, S2 – 12.9224, S3 – 12.8176.