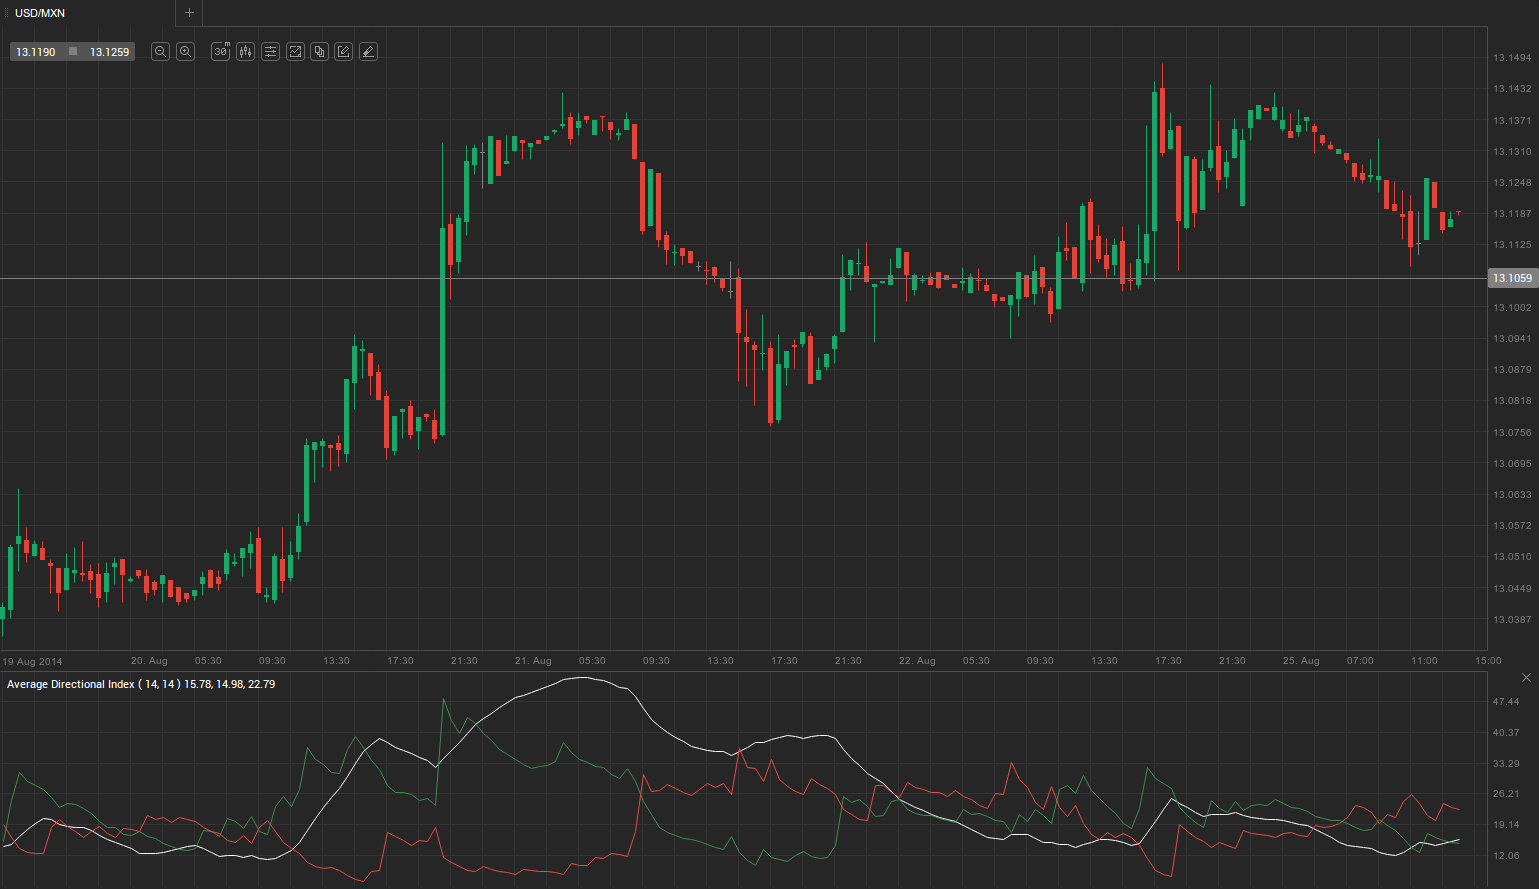
Friday’s trade saw USD/MXN within the range of 13.1511 – 13.0972. The pair closed at 13.1371, adding 0.20% on a daily basis and 0.52% on weekly.
At 11:04 GMT today USD/MXN was down 0.11% for the day to trade at 13.1226. The pair held in a daily range between 13.1118 and 13.1466.
Fundamental view
United States
A preliminary gauge prepared by Markit Economics is expected to show later today that activity in the US services sector probably slowed down in August, with the corresponding preliminary Purchasing Managers’ Index coming in at a reading of 59.5, according to the median forecast by analysts. In July, the PMI stood at 60.8. The index is based on a monthly survey, encompassing 400 business entities, operating in the services sector. Respondents give their estimate in regard to business conditions – sales, employment, inventories, prices. Values above the key level of 50.0 indicate optimism (expanding activity). As services comprise a dominant part of nation’s GDP, the performance of this indicator is of key importance for overall economic development assessment. Higher PMI readings would support the national currency. The preliminary data by Markit Economics is due out at 13:45 GMT on Monday.
Sales of new single-family houses in the United States probably reached the seasonally adjusted annualized level of 430 000 in July, following a level of 406 000 units in June, while the latter was 8.1% lower compared to that in May. The median sales price of new houses sold in June was $273 500, while the average sales price was $331 400. The seasonally adjusted estimate of new houses for sale at the end of June was 197 000, which represents a supply of 5.8 months at the current rate of sales.
The report on new home sales has a considerable impact on financial markets, as new home sales can trigger a rise in consumption. It is also an excellent indicator of any economic downturns or upturns due to the sensitivity of consumer income. For example, when new home sales drop over several months, this usually is a precursor to an economic depression.
Mexico
Mexicos National Institute of Statistics, Geography and Informatics (Instituto Nacional de Estadística y Geografía) will release Mexicos retail sales for June at 13:00 GMT. Retail sales measure the change in the total value of inflation-adjusted sales on the retail level. It is the primary indicator for consumer spending, which itself accounts for most of the economic activity. Thus, higher retail sales imply accelerating economic activity, which generally is seen as bullish for the local currency. Lower retail sales suggest the economy is cooling, which is in general bearish for the Mexican peso.
INEGI is expected to report a 0.4% jump in Junes retail sales, compared to a 0.1% contraction in May, while year-on-year receipts at retail stores probably rose 1.6%, matching the previous months growth.
Later in the day, Bank of Mexico is expected to report that the nations current account deficit probably narrowed to $4.011 billion in the second quarter from $4.544 billion in the first three months. The current account represents the net flow of current transactions, including goods, services and interest payments in and out of Mexico. A surplus in the category means the inflow of capital exceeds the reduction. Thus, a higher positive reading is generally seen as bullish for the national currency and vice versa.
Technical view
According to Binary Tribune’s daily analysis, the central pivot point for the pair is at 13.1285. In case USD/MXN manages to breach the first resistance level at 13.1597, it will probably continue up to test 13.1824. In case the second key resistance is broken, the pair will probably attempt to advance to 13.2136.
If USD/MXN manages to breach the first key support at 13.1058, it will probably continue to slide and test 13.0746. With this second key support broken, the movement to the downside will probably continue to 13.0519.
The mid-Pivot levels for today are as follows: M1 – 13.0633, M2 – 13.0902, M3 – 13.1172, M4 – 13.1441, M5 – 13.1711, M6 – 13.1980.
In weekly terms, the central pivot point is at 13.1079. The three key resistance levels are as follows: R1 – 13.1803, R2 – 13.2235, R3 – 13.2959. The three key support levels are: S1 – 13.0647, S2 – 12.9923, S3 – 12.9491.