International Business Machines Corp has formed a bull channel, following the bull spike on June 27th. The Directional Movement Index has climbed above its 20 level, while the +DI (green line) has crossed the -DI (red line) from bottom-up and has persistently been above it. The 20-day and the 50-day Exponential Moving Averages showed almost no reaction until mid July, with the 20-period EMA crossing above the 50-period average on July 14th, while later both of them crossed above the 200-day EMA. As a result, a perfect order can be observed (the shortest EMA is on top).
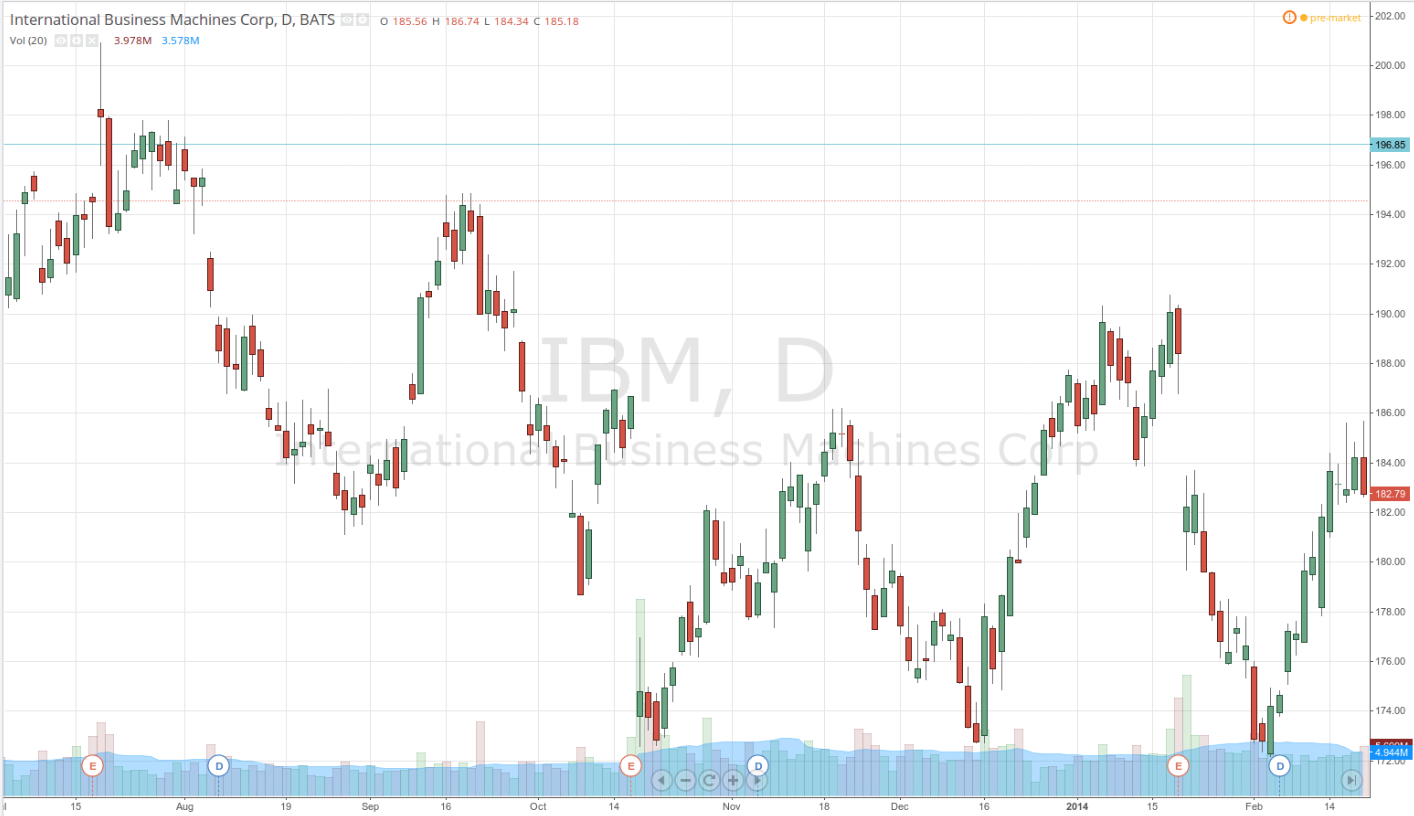
As we have a channel, it is reasonable to be aware that it could attempt to reverse its direction at any time. In case the price remains within the channel, we can expect a test of the swing high from late April ($196.86). The latter is a level, where strong resistance occurred in late July and the beginning of August 2013, as can be seen on the screenshot applied below.
In case IBM breaks above that high, then the next swing points to be tested will probably be the highs from April 16th ($198.71) and April 10th ($199.21, a level useen since July 18th 2013). As a confirmation of this scenario, the perfect order of the three EMAs is still valid, +DI is above -DI and the DMI is well above its 25 level (suggesting considerable bull strength).
In case the price returns to the lower boundary of the channel and begins to close consistently below it, then we may expect a test of the beginning of the bull channel itself.
The central weekly pivot point for the stock is at $193.17. IBM may encounter the Resistance 1 level at $196.99 (the green horizontal line). If the price manages to penetrate it, upside momentum may continue to the R2 level at $199.72. With the second resistance broken, the move up may extend to R3 at $203.55.
If, however, the stock plunges, initial support will be encountered at the 20-day EMA, followed by the first support pivot point (S1) at $190.45 (the top red line). In case the move to the downside continues, S2 and S3 will be tested at $186.63 and $183.91 respectively.