During Friday’s trading session USD/ZAR traded within the range of 10.4864-10.5482 and closed at 10.5107, losing 0.17% for the day.
At 6:32 GMT today USD/ZAR was losing 0.10% for the day to trade at 10.5005. The pair touched a daily low at 10.4880 at 3:00 GMT.
Fundamental view
United States
The index of pending home sales in the United States probably rose 0.4% during June compared to May, according to the median forecast by experts. In May the indicator registered a third consecutive month of gains and also reached its highest level in the past eight months, rising 6.1%. Low mortgage rates, increasing number of homes for sale and higher employment in the country probably contributed to higher activity in the housing sector.
When a sales contract is accepted for a property, it is recorded as a pending home sale. As an indicator the index provides information on the number of future home sales, which are in the pipeline. It gathers data from real estate agents and brokers at the point of a sale of contract and is currently the most accurate indicator regarding US housing sector. It samples over 20% of the market. In addition, over 80% of pending house sales are converted to actual home sales within 2 or 3 months. Therefore, this index has a predictive value about actual home sales.
Although there are some cancellations, there are not enough for the data to be skewed one way or another. The base value of the index is equal to 100, while the base year is 2001, when there has been a high level of home sales.
The National Association of Realtor’s (NAR) will release the official index value at 14:00 GMT on Monday (July 28th). In case pending home sales increased more than anticipated, this would have a bullish effect on the greenback.
Technical view
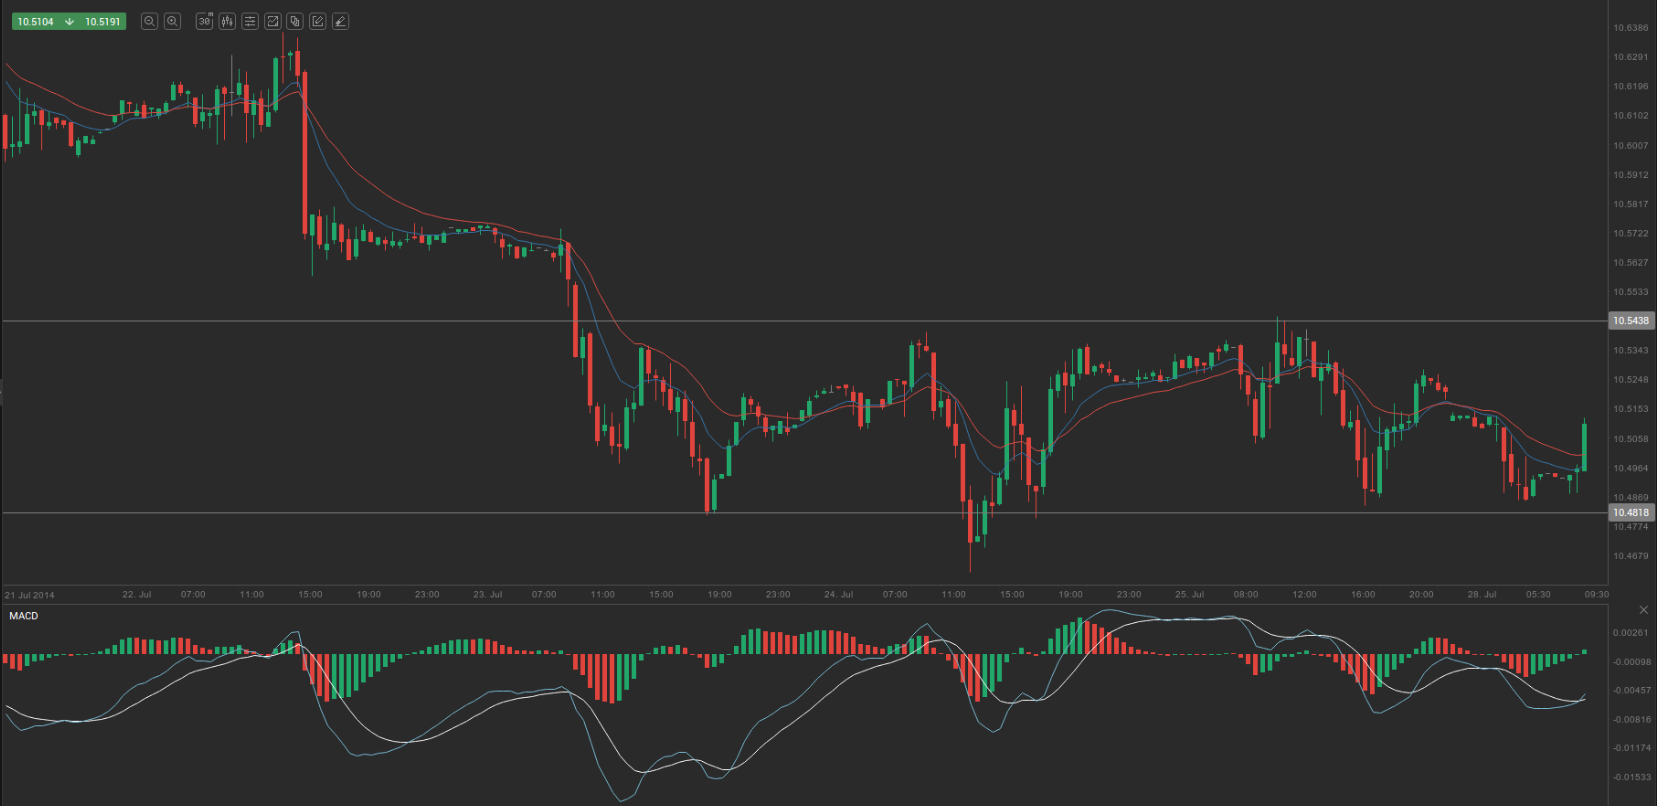
According to Binary Tribune’s daily analysis, the central pivot point for the pair is at 10.5151. In case USD/ZAR manages to breach the first resistance level at 10.5438, it will probably continue up to test 10.5769. In case the second key resistance is broken, the pair will probably attempt to advance to 10.6056.
If USD/ZAR manages to breach the first key support at 10.4818, it will probably continue to slide and test 10.4533. With this second key support broken, the movement to the downside will probably continue to 10.4202.
In weekly terms, the central pivot point is at 10.5477. The three key resistance levels are as follows: R1 – 10.6297, R2 – 10.7487, R3 – 10.8307. The three key support levels are: S1 – 10.4287, S2 – 10.3467, S3 – 10.2277.