Here you can find information about the different chart patterns that you can use to trade binary options trading: cup and handle, double tops and bottoms, triangles, flag and pennant, wedge, gaps.
Cup and Handle
 Cup and handle is another one of the popular patterns chartists often look for. Unlike the head and shoulders, though, its a continuation pattern (meaning that it suggests the trend we were observing prior to the pattern will continue at the completion). What makes this pattern so special is that it predicts a pause in the price increase, or even a brief decrease. This is where many investors who are not familiar with the pattern are prone to making mistakes and faulty predictions. You can clearly see the “cup” and the “handle” in the example below.
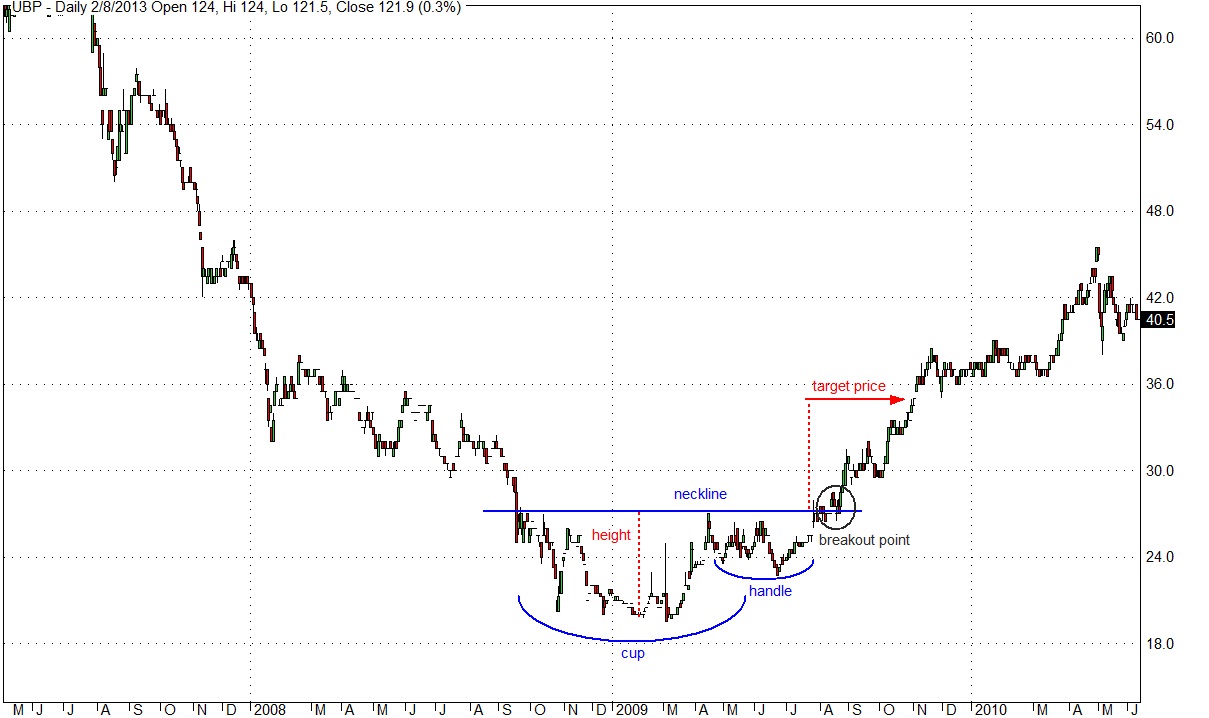
You can clearly see the upward trend on the example, followed by a brief decrease before another increase (which forms the “cup”), and then we have a smaller movement of similar directions before the price skyrockets. Cup and handle is a fairly simple pattern and is very easy to identify. The time frame it covers is usually from a few months to more than a year.
Double Tops and Bottoms
 Keeping up with the most popular patterns youre likely to see in a chart, double tops and bottoms is another spectacularly reliable reversal pattern. Like heads and shoulders, it signals that trend is about to go in the opposite direction. The chief characteristic of this pattern is that it forms after a stable trend. The genesis of the pattern begins when the price movement tests (which means that it tries to go beyond them but isnt able to break through) either the support or resistance (for double bottom and double top respectively). The pattern is very dependable and usually hints of mid to long-term trend reversals.
For double top, we observe that the price attempts to break the resistance two times, and is both times unsuccessful (look at the example below). The resistance proves too strong for the price, so the upward movement stops at the resistance level two time in a row. After the second unsuccessful attempt, the price takes a dive and begins a new downtrend.
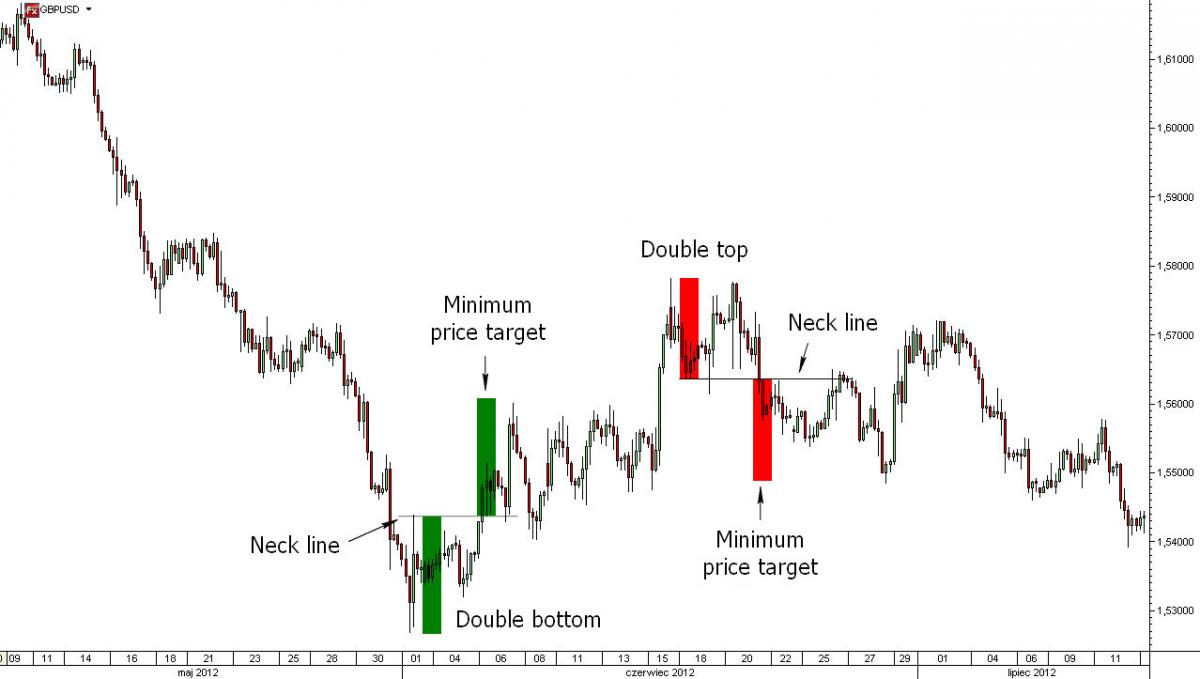
The double bottom pattern is the exact opposite of the double top pattern. Just like its polar opposite, it is preceded by a trend (in this case a downtrend) and upon reaching the support levels, it bounces up two time in a row and then begins an obvious ascend, which signals a new uptrend.
Triangles
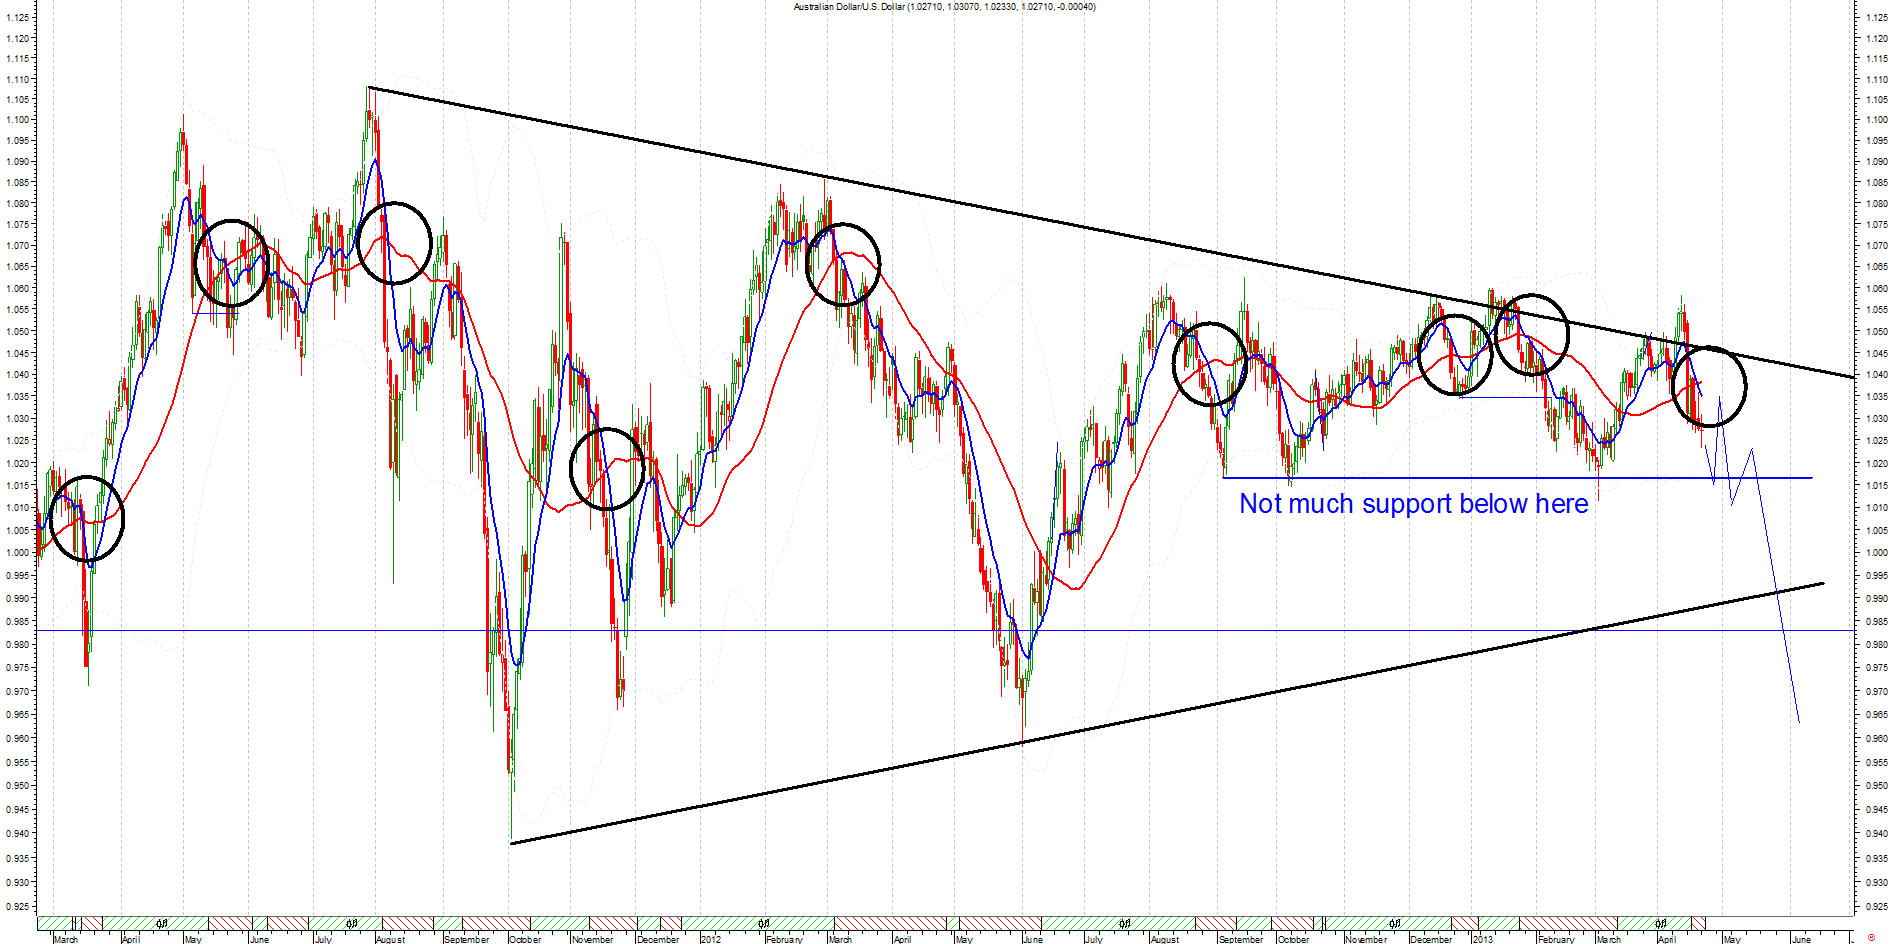
 All of the patterns weve examined so far are well-known and reliable, making them the perfect tools for technical analysis. Triangles are no exception. There are three main types of triangles – symmetrical, ascending and descending. Each type is characterized with different properties and carries different implications, but they have one thing in common – their timeframe, which usually ranges from a few weeks to a few months.
Symmetrical triangles are by far the simplest of the bunch. They are preceded by a couple of trend lines that gradually approach one another until a breakout point in either upward or downright direction. Wherever the breakout is headed, we know we have a stable trend in that direction. The support and resistance serve as the sides of the triangle. See example below.
In the ascending triangle pattern, the resistance is flat while the support is ascending (hence the name). There is usually an upside breakout after that confirming the trend. See example below.
Descending triangle is the polar opposite of the ascending triangle. The support is flat and the resistance is descending. The breakout is downside and confirms the emerging downtrend. See example below.
All of the triangle patterns are very reliable and almost always confirm the emerging trends. A competent analyst can easily spot them and predict the markets momentum for the near future. Its important to spot the patterns early and identify them because sometimes the emerging trends can be quite drastic. This is no cause for concern if you know what to look for, though.
Flag and Pennant
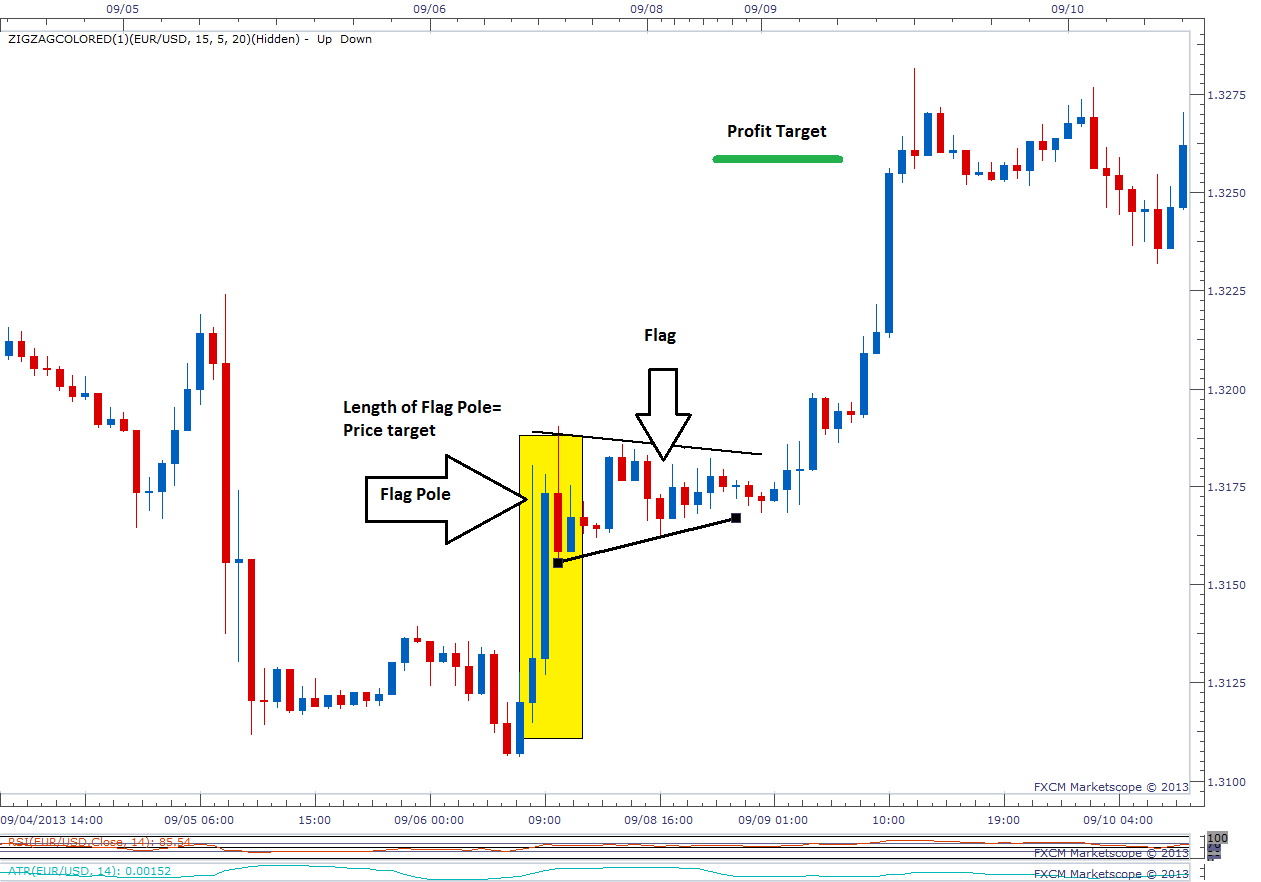
 The basis of the flag and pennant chart patterns lies in the sudden price movement, which is then followed by a period of stability, only to be completed by another price movement is the same direction as the first one which signals of the emergence of a trend. Flag and pennant patterns are very short-term and rarely last most than three weeks. They are both continuation patterns.
As you can see in the example below, the pennant pattern resembles the symmetrical triangle one. However, this pattern is short-term, with the two diverging trend lines approaching each other before the movement of the price in an upward direction. See example below.
The flag pattern is different in the sense that the trend lines dont diverge. Instead, they are parallel in the case of the flag, but the same end result is expected from this pattern, as well. See example below.
Wedge
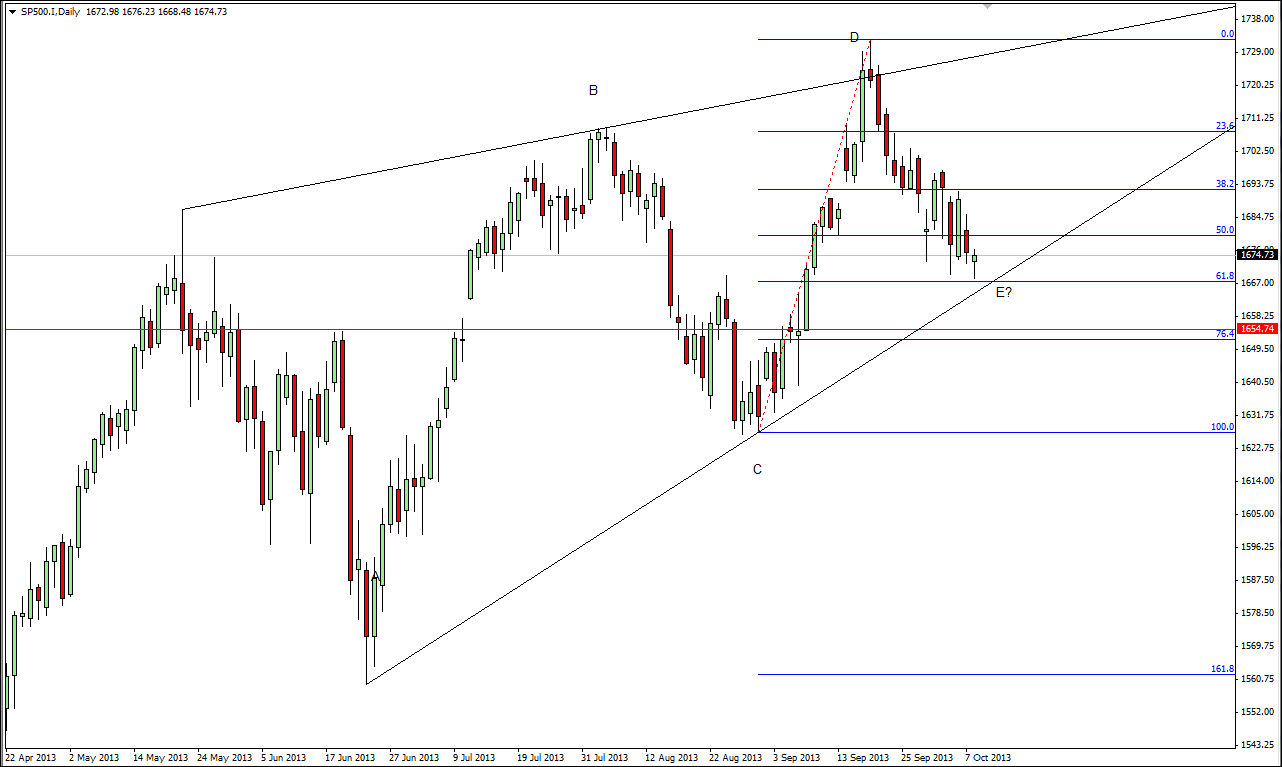
 The wedge pattern is a bit more complicated than other patterns weve viewed so far in the sense that it can be either a continuation or a reversal pattern. It is very similar to the symmetrical triangle in nature, with two significant differences. The first difference is that the wedge patterns follow an upright or downright direction, whereas the symmetrical triangle follows a stable sideway direction. Another important difference between the two patterns is that the wedge tends to be observed over longer periods of time – in most cases between three and six months.
The dual nature of the wedges makes them a bit confusing. They are easy to miss for an initiate in the art of technical analysis, although an experienced analyst can always spot them. To make things easier for you to understand, we will give you general guidelines of how things usually play in regards to these patterns. Note that this might not always be the case. In time, though, if you are truly determined, you will be able to learn how to recognize them. Heres an example. Say we have a downward wedge (meaning the two trend lines are converging in a downward direction). In most cases, if price breaks upward, then we have a continuation pattern but if it breaks downward, we have a reversal pattern. See example below.
Gaps
 A gap is an interesting phenomenon that usually occurs when there is a significant event in the field or niche of an asset. Gaps can be spotted on bar charts and candlestick charts but wont be seen in line charts or point and figure charts. A gap is momentous difference between the prices in two consecutive trading periods. It can be a significant jump or dip in the price of an asset.
There are three types of gaps. Breakaway gaps form at the beginning of a trend; runaway gaps form in the middle of trends; and finally exhaustion gaps from at the end of a trend.
Triple Tops and Bottoms
 Triple tops and bottoms act in a very familiar manner. They closely resemble the double tops and bottoms even though they are much rarer. Like double tops and bottoms, triple tops and bottoms test the resistance or support. Unlike the double tops and bottoms, they do it three times instead of two (as the name suggests). Once again the prices cant break through which means a reversal of the preceding trend.
The confusing aspect of triple tops and bottoms is that it can closely resemble double tops and bottoms. An inexperienced chartist or analyst might be led to believe that the pattern is double top or bottom in the genesis of the pattern and make hasty decisions. This is why patience is the name of the game when it comes to these types of patterns. Precision is a very important component and this is where the analysts abilities and intuition come into play. He is either going to realize that the emerging pattern is a triple top or bottom or he wont. However, fear not, as with with experience you will learn to recognize them. Of course, we all make mistakes but this is just the risk of the job.