Key Moments
- META last traded at $611.08, slipping 0.11% over 24 hours, with price holding just below its $612.77 pivot.
- Meta reportedly raised $15 billion in a five-part US dollar bond sale to fund AI infrastructure, following prior large bond offerings.
- Technical indicators show META below major moving averages with negative MACD, while derivatives positioning is modestly long but not aggressive.
Overview: Price Action Around a Critical Pivot
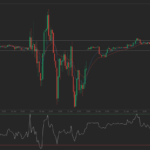
Meta Platforms Tokenized Stock (META) was last quoted at $611.08, down 0.11% over the prior 24 hours. Trading stayed confined between $606.43 and $620.81, with reported volume of $19.97 million on Binance Futures. The price remains close to its identified pivot at $612.77, but still trades under immediate resistance at $619.12 and stronger resistance at $627.15.
Debt-Funded AI Expansion Shapes the Fundamental Backdrop
On the corporate side, Reuters reported on November 3, 2026 that Meta raised $15 billion via a five-part US dollar bond issuance to support accelerating AI infrastructure spending. According to the same report, this follows earlier debt offerings, including a $25 billion investment-grade bond sale in April and a $30 billion transaction last year. The takeaway from the issuance pattern is that Meta continues to finance its AI buildout with sizeable borrowings, making capital structure and balance-sheet flexibility central to the investment narrative, in addition to advertising and revenue trends.
Technical Picture: Below Trend Lines with Soft Momentum
From a technical standpoint, the short-term structure appears fragile. META is trading beneath several key moving averages: the 7-day simple moving average (SMA) at $614.22, the 20-day SMA at $626.97, the 50-day SMA at $689.45, and the 200-day SMA at $626.42. The 12-day exponential moving average (EMA) at $619.44 and the 26-day EMA at $640.84 also sit overhead, underscoring that the recent recovery has not yet re-established a bullish trend configuration.
Momentum indicators point to subdued rather than capitulatory conditions. The relative strength index (RSI) stands at 37.55, characterized as neutral. MACD is negative at -21.3997 with a flat histogram, signaling weak directional drive rather than an active downside acceleration. Stochastic readings, with %K at 45.54 and %D at 36.43, leave room for a rebound but fall short of confirming a decisive trend reversal.
Bollinger Bands and Volatility Signals
Bollinger metrics align with the cautious tone. The middle band is positioned at $626.97, while the lower band is at $579.58. A %B reading of 0.3319 indicates that price is skewed toward the lower half of the banded range and is not challenging the upper band at $674.37. Average true range (ATR) of $18.47 suggests that, once a break occurs, price could move quickly enough to overshoot nearby technical levels.
| Indicator | Level / Value |
|---|---|
| Last price | $611.08 |
| 24h range | $606.43 – $620.81 |
| 24h volume (Binance Futures) | $19.97 million |
| Pivot | $612.77 |
| Immediate resistance | $619.12 |
| Stronger resistance | $627.15 |
| 7-day SMA | $614.22 |
| 20-day SMA | $626.97 |
| 50-day SMA | $689.45 |
| 200-day SMA | $626.42 |
| 12-day EMA | $619.44 |
| 26-day EMA | $640.84 |
| RSI | 37.55 |
| MACD | -21.3997 |
| Stochastic %K / %D | 45.54 / 36.43 |
| Bollinger middle / lower band | $626.97 / $579.58 |
| Bollinger upper band | $674.37 |
| %B | 0.3319 |
| ATR | $18.47 |
Derivatives Flows: Mild Long Bias, No Clear Conviction
Derivatives metrics on Binance Futures present a neutral-to-slightly bullish stance. The funding rate sits at 0.0000%, indicating that neither longs nor shorts are paying a meaningful premium to maintain positions. Open interest totals 44,369.22 contracts, with daily open interest value at $26.74 million and a 24-hour open interest change of -0.18%, implying that positioning has not been expanding in a decisive way.
Positioning by account type tilts toward the long side. Across all global accounts, 64.6% are long versus 35.4% short. Among top-trader accounts, 69.9% are long against 30.1% short. This bias is supportive, but on its own does not offset the currently weaker chart structure. Taker flow also appears balanced: a 1-hour taker buy/sell ratio of 1.0984 points to only limited net buying rather than a forceful upside push.
Key Technical Levels: Support, Resistance, and Next Reference Points
On the downside, immediate support is identified at $604.74, with stronger support at $598.39. A break beneath these zones would expose the area around the lower Bollinger band near $579.58 as the next clearly defined technical target below current price.
On the upside, the initial objective is a move back above $619.12, followed by a challenge of $627.15. A sustained push through that band would start to repair the technical damage from the recent pullback and bring the 20-day moving average back into focus. Until those resistance levels are convincingly cleared, any strength is more appropriately viewed as a rally into overhead supply rather than confirmation of a renewed uptrend.
Conclusion: Buyers Still Need to Prove Control
META is not showing signs of disorderly selling, but the advantage remains with skeptics until buyers reclaim key technical markers. Meta’s decision to fuel AI infrastructure expansion with new bond issuance is a meaningful strategic signal, yet the tokenized stock on Binance Futures continues to trade below important moving averages, with negative MACD and only moderately supportive derivatives positioning.
The next important signal comes from price behavior around $604.74. If that level holds, conditions remain consistent with a continued range-bound environment. If it breaks, attention shifts to $598.39 and to the lower Bollinger band near $579.58 as the next downside reference areas.
 TradingPedia.com is a financial media specialized in providing daily news and education covering Forex, equities and commodities. Our academies for traders cover